In this guide, we explore one of the most important sensing modules in the LiteWing drone, the Inertial Measurement Unit (IMU). While the IMU isn’t located on the Flight Positioning Module, it’s a core part of the flight controller, providing orientation, angular rates, and linear acceleration, forming the backbone of all autonomous flight behaviors.
By the end of this guide, you will understand:
- How Euler angles (roll, pitch, yaw) relate to drone orientation and how they differ from raw IMU readings.
- How to stream and interpret real-time IMU telemetry via CRTP logging.
- How to visualize live sensor trends in Python and analyze accelerometer behavior during different flight states.
Table of Contents
Software Setup
Before proceeding with any coding examples, your development environment must be properly set up. This includes installing Python, configuring the required libraries, and ensuring that your PC can establish a CRTP link with the LiteWing. Since cflib has a few prerequisites that must be met, refer to the LiteWing Python SDK Programming Guide. That document provides detailed instructions for installing dependencies, setting up cflib, connecting to the LiteWing Wi-Fi interface, and validating communication with a simple test script. Completing that setup is necessary before attempting to interact with any sensor on the LiteWing Drone and its Flight Positioning Module. Browse detailed drone tutorials with source code covering flight control modules, sensor integration, and programming examples.
Understanding the IMU
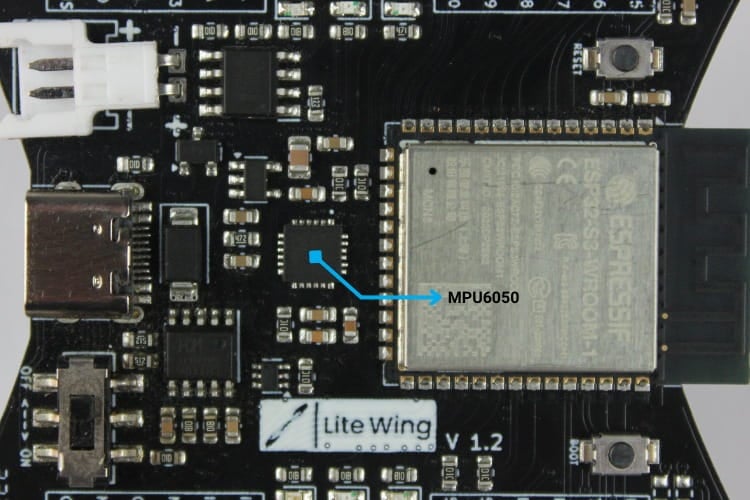
The IMU MPU6050 is responsible for measuring orientation and linear acceleration. It contains a set of gyroscopes and accelerometers whose signals are fused by the drone’s onboard estimator to produce stable orientation estimates. The raw measurements remain accessible, allowing you to compare unfiltered data to the fused outputs.
Euler Angles (Drone Orientation)
IMU orientation is expressed as Euler angles roll, pitch, and yaw, which describe how the drone rotates about its three axes. Roll represents rotation around the X-axis (tilt left/right), pitch represents rotation around the Y-axis (tilt forward/back), and yaw represents rotation around the Z-axis (turn left/right).
Orientation Ranges:
| Angle | Axis | Description | Typical Range |
| Roll (ϕ) | X-axis | Left/right tilt | −180° to +180° |
| Pitch (θ) | Y-axis | Forward/back tilt | −90° to +90° |
| Yaw (ψ) | Z-axis | Clockwise/counter-clockwise rotation | −180° to +180° |
To illustrate this concept, a drone resting flat on a table reports a roll of approximately 0° and a pitch of approximately 0°. Tilting the drone forward increases the pitch angle, while rotating it clockwise increases the yaw angle.
Accelerometer Readings
The accelerometer measures linear acceleration along the drone’s local X, Y, and Z axes. These values describe how the drone’s motion is changing rather than its orientation.
Acceleration Interpretation:
| Axis | Meaning | Resting Value | Notes |
| acc.x | Forward/backward acceleration | 0 m/s² | Positive when accelerating forward |
| acc.y | Left/right acceleration | 0 m/s² | Positive when accelerating right |
| acc.z | Up/down acceleration | ~0 m/s² | In gravity: moves toward 9.81 m/s² during fall |
CRTP Communication for IMU Data
To access IMU telemetry, we use the CRTP logging system in cflib. The drone exposes both raw IMU values and the fused state-estimator outputs.
Available IMU Log Variables:
| Category | Variables | Description |
| Acceleration (fused) | stateEstimate.ax, stateEstimate.ay, stateEstimate.az | Linear acceleration in m/s² |
| Orientation (fused) | stateEstimate.roll, stateEstimate.pitch, stateEstimate.yaw | Kalman-filtered, stable orientation values |
Connecting to these variables at 20-50 Hz allows you to visualize how the drone reacts as you tilt, rotate, or move it.
Code Explanation (test_imu.py)
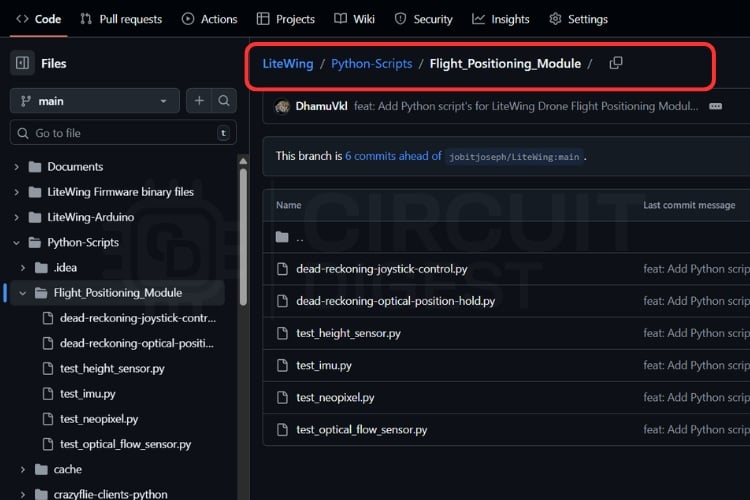
The test_imu.py script is a desktop IMU monitor for the LiteWing drone. It connects to the drone over CRTP, gets to IMU-related log variables, and plots orientation in real time while showing the latest IMU values in a status bar. The application is built around a Tkinter GUI and a Matplotlib plot embedded into the same window. You can get the script on our LiteWing GitHub repository under LiteWing/Python-Scripts/Flight_Positioning_Module/


At a high level, the architecture looks like this:
| Component | Sub-Component | Details |
| IMU Test Application | Connection Management | SyncCrazyflie |
| Log Streaming | IMU-related variables | |
| Orientation (Euler angles) | |
| Linear acceleration | |
| Data Processing | Circular buffers | Implemented using deque |
| Thread-safe updates | Ensures safe multi-threaded access | |
| Real-Time Visualization | Orientation plot | Euler angles vs. time |
| Numeric status | Current attitude + acceleration |
Imports and Constants
import threading
import time
from collections import deque
import tkinter as tk
import matplotlib
matplotlib.use("TkAgg")
from matplotlib.backends.backend_tkagg import FigureCanvasTkAgg
from matplotlib.figure import Figure
import cflib.crtp
from cflib.crazyflie import Crazyflie
from cflib.crazyflie.log import LogConfig
from cflib.crazyflie.syncCrazyflie import SyncCrazyflie
Responsibilities of each import group:
| Group | Role in Script |
| threading, time, deque | Background worker, timing, bounded history buffers |
| tkinter | GUI window, buttons, labels, layout |
| matplotlib + FigureCanvasTkAgg | Live plotting inside Tk window |
| cflib.* | CRTP driver initialization, log configuration, CF connection |
Script-level configuration:
DRONE_URI = "udp://192.168.43.42"
LOG_PERIOD_MS = 50  # 20 Hz is sufficient for visualization
# Number of historical samples to retain for plotting (bounded memory usage)
HISTORY_LENGTH = 400
These values define the target drone address, log sampling period, and the size of the rolling history window.
Class IMUTestApp - High-Level Role
The IMUTestApp class encapsulates the entire application: GUI, CRTP connection, logging, data storage, and plotting.
class IMUTestApp:
   """
GUI application to visualize IMU / state estimator data from LiteWing.
The class connects via the Crazyflie Python client, subscribes to logged variables (angles & acceleration), and displays them in a simple Tk GUI with runtime plots for recent samples. Data is streamed in a background thread and updates the GUI periodically without blocking user interaction.
   """
Core responsibilities
| Responsibility | Description |
| Connection management | Open/close CRTP link in a background thread |
| Log configuration | Subscribe to state estimator orientation and accel |
| Data handling | Store time-series data in fixed-length deques |
| GUI updates | Show latest values and update plot periodically |
GUI and State Initialization
The constructor receives a tk.Tk root and initializes all UI and state:
def __init__(self, root: tk.Tk):
       self.root = root
       self.root.title("LiteWing IMU Test")
       self.root.geometry("1100x720")
Display variables are defined using StringVar:
self.status_var = tk.StringVar(value="Status: Idle")
       self.roll_var = tk.StringVar(value="Roll: 0.00°")
       self.pitch_var = tk.StringVar(value="Pitch: 0.00°")
       self.yaw_var = tk.StringVar(value="Yaw: 0.00°")
       self.acc_var = tk.StringVar(value="Accel XYZ: 0.00, 0.00, 0.00 m/s²")
These support automatic label updates when .set() is called.
Layout and plot setup:
       self._build_controls()
       self._build_plot()
Threading and data structures:
self.stop_event = threading.Event()
       self.connection_thread: threading.Thread | None = None
       self.data_lock = threading.Lock()
       self.timestamps = deque(maxlen=HISTORY_LENGTH)
       self.roll_history = deque(maxlen=HISTORY_LENGTH)
       self.pitch_history = deque(maxlen=HISTORY_LENGTH)
       self.yaw_history = deque(maxlen=HISTORY_LENGTH)
       self.last_console_print = 0.0
Purpose of internal state:
| Attribute | Purpose |
| stop_event | Signals the worker thread to terminate |
| connection_thread | Holds the active worker thread, if any |
| data_lock | Protects shared history buffers across threads |
| timestamps | Absolute time of each sample |
| roll_history | Time series of roll values |
| pitch_history | Time series of pitch values |
| yaw_history | Time series of yaw values |
| last_console_print | Rate limiting for console debug output |
Periodic GUI refresh and clean shutdown:
self.root.after(100, self._refresh_gui)
       self.root.protocol("WM_DELETE_WINDOW", self._on_close)
Buttons and Live Value Display
The _build_controls method sets up the upper part of the GUI.
Control bar:
   def _build_controls(self) -> None:
       """Create the top control bar with Start/Stop buttons and status label."""
       top_frame = tk.Frame(self.root)
       top_frame.pack(fill=tk.X, padx=10, pady=6)
       tk.Button(top_frame, text="Start", command=self.start, bg="#28a745", fg="white", width=12).pack(side=tk.LEFT, padx=5)
       tk.Button(top_frame, text="Stop", command=self.stop, bg="#dc3545", fg="white", width=12).pack(side=tk.LEFT, padx=5)
       tk.Label(top_frame, textvariable=self.status_var, font=("Arial", 11, "bold"), fg="blue").pack(side=tk.LEFT, padx=20)
Value bar:
       value_frame = tk.Frame(self.root)
       value_frame.pack(fill=tk.X, padx=10, pady=6)
       tk.Label(value_frame, textvariable=self.roll_var, font=("Arial", 12)).pack(side=tk.LEFT, padx=10)
       tk.Label(value_frame, textvariable=self.pitch_var, font=("Arial", 12)).pack(side=tk.LEFT, padx=10)
       tk.Label(value_frame, textvariable=self.yaw_var, font=("Arial", 12)).pack(side=tk.LEFT, padx=10)
       tk.Label(value_frame, textvariable=self.acc_var, font=("Arial", 12)).pack(side=tk.LEFT, padx=10)
Resulting UI sections:
| Element | Function |
| Start button | Begins background CRTP connection/logging |
| Stop button | Signals worker to stop and end logging |
| Status label | Shows current state of application |
| Roll/Pitch/Yaw label | Shows latest orientation values |
| Accel label | Shows latest acceleration triple |
Orientation Plot Setup
This method constructs the Matplotlib figure for time-series visualization:
def _build_plot(self) -> None:
       """Set up the matplotlib figure and axes for live plotting."""
       self.figure = Figure(figsize=(11, 6), dpi=100)
       self.axis = self.figure.add_subplot(1, 1, 1)
       # Plotting area for roll, pitch and yaw vs time. The plot uses a
       # single shared axis to keep orientation lines aligned so small
       # changes are easily visible.
       self.axis.set_title("Orientation (Roll/Pitch/Yaw)")
       self.axis.set_xlabel("Time (s)")
       self.axis.set_ylabel("Angle (°)")
       self.axis.grid(True, alpha=0.3)
Three line objects are prepared for dynamic data assignment:
       (self.roll_line,) = self.axis.plot([], [], label="Roll", color="tab:red")
       (self.pitch_line,) = self.axis.plot([], [], label="Pitch", color="tab:green")
       (self.yaw_line,) = self.axis.plot([], [], label="Yaw", color="tab:blue")
       self.axis.legend(loc="upper right")
The figure is then embedded into the Tk application:
       canvas = FigureCanvasTkAgg(self.figure, master=self.root)
       canvas.draw()
       canvas.get_tk_widget().pack(fill=tk.BOTH, expand=True, padx=10, pady=10)
       self.canvas = canvas
All three orientation traces share a common time axis, which simplifies comparative analysis.
Worker Thread Lifecycle
The start method ensures that only one background worker is active:
   def start(self) -> None:
       """Spawn the background connection worker thread if not already running."""
       # Prevent launching multiple background workers
       if self.connection_thread and self.connection_thread.is_alive():
           return
       self.stop_event.clear()
       # Start a daemon thread that will connect and manage log callbacks
       self.connection_thread = threading.Thread(target=self._connection_worker, daemon=True)
       self.connection_thread.start()
The stop method signals the worker to terminate:
   def stop(self) -> None:
       self.stop_event.set()
No blocking or joining occurs in the GUI thread, so the interface remains responsive.
CRTP Setup and Logging
This method handles all communication with the drone:
   def _connection_worker(self) -> None:

       self._set_status("Status: Connecting...")
       try:
           # Initialize the Crazyradio drivers (disabling the debug radio by
           # default) so this machine can talk to Crazyflie.
           cflib.crtp.init_drivers(enable_debug_driver=False)
           with SyncCrazyflie(DRONE_URI, cf=Crazyflie(rw_cache="./cache")) as scf:
               cf = scf.cf
               self._set_status("Status: Connected")
A log configuration is created with desired variables:
               log_config = LogConfig(name="IMUSensor", period_in_ms=LOG_PERIOD_MS)
               available_vars = [
                   ("stateEstimate.roll", "float"),
                   ("stateEstimate.pitch", "float"),
                   ("stateEstimate.yaw", "float"),
                   ("stateEstimate.ax", "float"),
                   ("stateEstimate.ay", "float"),
                   ("stateEstimate.az", "float"),
               ]
These candidates are then filtered by the firmware TOC:
               if not self._add_variables_if_available(cf, log_config, available_vars):
                   self._set_status("Status: IMU variables unavailable")
                   return
If at least one variable is valid, the logging session is started:
log_config.data_received_cb.add_callback(self._log_callback)
               cf.log.add_config(log_config)
               log_config.start()
               print("[IMU] Logging started")
The worker loop keeps the session alive until stopped:
               while not self.stop_event.is_set():
                   time.sleep(0.1)
               log_config.stop()
               print("[IMU] Logging stopped")
Exceptions set an error state and return the application to idle.
Firmware TOC Guard
This helper checks the drone’s log TOC before subscribing:
def _add_variables_if_available(self, cf: Crazyflie, log_config: LogConfig, candidates: list[tuple[str, str]]) -> bool:
       """Check TOC and add requested variables if available on the aircraft.

       Prevents errors from attempting to subscribe to non-existent variables.
       """
       # Examine the Crazyflie Log TOC to check which variables are present on
       # the running firmware image.
       toc = cf.log.toc.toc
       added = 0
       for full_name, var_type in candidates:
           group, name = full_name.split(".", maxsplit=1)
           if group in toc and name in toc[group]:
               # Add the variable to the log request so it will be streamed
               # with the given period.
               log_config.add_variable(full_name, var_type)
               print(f"[IMU] Logging {full_name}")
               added += 1
           else:
               print(f"[IMU] Missing {full_name}")
       return added > 0
This prevents runtime errors caused by firmware images that might not expose all expected variables.
Receiving and Storing Samples
The _log_callback method is called on the worker thread whenever a new log packet arrives:
def _log_callback(self, timestamp: int, data: dict, _: LogConfig) -> None:
       # Extract the latest sample from the log packet. When data isn't
       # present, default to zero so the GUI will show a neutral state.
       # NOTE: The angle units depend on the firmware; convert to degrees if
       # required before displaying.
       roll = data.get("stateEstimate.roll", 0.0)
       pitch = data.get("stateEstimate.pitch", 0.0)
       yaw = data.get("stateEstimate.yaw", 0.0)
       # Accelerations in m/s^2 as reported by the state estimator/IMU fusion
       ax = data.get("stateEstimate.ax", 0.0)
       ay = data.get("stateEstimate.ay", 0.0)
       az = data.get("stateEstimate.az", 0.0)
Values are inserted into the history buffers under a lock:
       with self.data_lock:
           now = time.time()
           self.timestamps.append(now)
           self.roll_history.append(roll)
           self.pitch_history.append(pitch)
           self.yaw_history.append(yaw)
           # Store all telemetry so the GUI top bar can access the latest values
           self.latest_values = (roll, pitch, yaw, ax, ay, az)
Console debug output is rate-limited to once per second:
       if time.time() - self.last_console_print >= 1.0:
           self.last_console_print = time.time()
           print(
               f"[IMU] Roll={roll:.2f}°, Pitch={pitch:.2f}°, Yaw={yaw:.2f}°, "
               f"Accel=({ax:.2f}, {ay:.2f}, {az:.2f}) m/s²"
           )
This provides a concise textual summary of the current IMU state.
Updating Labels and Plot
This method is scheduled by Tk to run every 100 ms:
def _refresh_gui(self) -> None:
       # Periodically copy data from history buffers and update GUI elements
       # and plots; this function runs in the main Tk event loop.
       with self.data_lock:
           if getattr(self, "latest_values", None):
               # Update the status bar with the most recent values
               roll, pitch, yaw, ax, ay, az = self.latest_values
               self.roll_var.set(f"Roll: {roll:.2f}°")
               self.pitch_var.set(f"Pitch: {pitch:.2f}°")
               self.yaw_var.set(f"Yaw: {yaw:.2f}°")
               self.acc_var.set(f"Accel XYZ: {ax:.2f}, {ay:.2f}, {az:.2f} m/s²")
A relative time axis is constructed for plotting:
               times = list(self.timestamps)
               if times:
                   # Build a relative time axis (seconds since first sample)
                   t0 = times[0]
                   rel_times = [t - t0 for t in times]
                   # Copy the history lists for plotting to avoid holding the
                   # lock while matplotlib draws and to prevent race conditions.
                   roll_vals = list(self.roll_history)
                   pitch_vals = list(self.pitch_history)
                   yaw_vals = list(self.yaw_history)
Line data is updated without recreating the line objects:
                   # Update the plot lines (only data, not axes limits)
                   self.roll_line.set_data(rel_times, roll_vals)
                   self.pitch_line.set_data(rel_times, pitch_vals)
                   self.yaw_line.set_data(rel_times, yaw_vals)
The X-axis shows the most recent 20 seconds:
                   # Keep a recent window of time visible for context (20 seconds)
                   last_time = rel_times[-1] if rel_times[-1] > 1 else 1
                   self.axis.set_xlim(max(0, last_time - 20), last_time + 1)
The Y-axis is scaled around min/max values with a margin:
                   # Compute Y limits around the min/max angle values with some
                   # margin so the lines don't hug the axis.
                   all_vals = roll_vals + pitch_vals + yaw_vals
                   vmin = min(all_vals) if all_vals else -5
                   vmax = max(all_vals) if all_vals else 5
                   margin = max(5, (vmax - vmin) * 0.2)
                   self.axis.set_ylim(vmin - margin, vmax + margin)
Redrawing is triggered in an efficient way:
                   self.canvas.draw_idle()
       self.root.after(100, self._refresh_gui)
The combination of a separate worker thread and periodic GUI refresh keeps both data acquisition and visualization smooth.
_set_status and _on_close
Two small utility methods manage status and shutdown:
   def _set_status(self, text: str) -> None:
       self.status_var.set(text)
   def _on_close(self) -> None:
       self.stop()
       self.root.after(200, self.root.destroy)
On window close, logging is stopped and the GUI is destroyed after a short delay to allow the worker thread to exit.
main() Entry Point
The script entry point creates the Tk root and runs the application:
def main() -> None:
   root = tk.Tk()
   app = IMUTestApp(root)
   root.mainloop()
if __name__ == "__main__":
   main()
This structure allows the module to be imported without side effects, while still working as an executable script when run directly.
Testing the Script Output
After running test_imu.py, the application window opens and when you click Start it attempts to connect to the LiteWing drone over CRTP. Once the connection is successful, the status indicator changes from Idle to Connected, and live IMU telemetry begins streaming automatically.
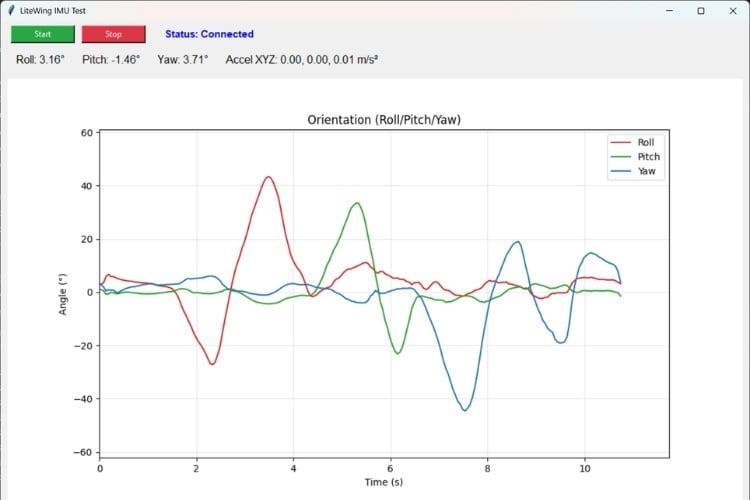
With the drone placed flat on a stable surface, the orientation values remain close to their neutral state. Roll and pitch stay near 0°, while yaw may show any value depending on the drone’s heading. The orientation plot shows nearly flat lines, indicating that the estimator is stable and no rotation is occurring. The acceleration display reports values close to 0 m/s² on the X, Y and Z axis.
Slowly tilting the drone by hand produces immediate changes in the displayed roll and pitch values. Tilting left or right causes the roll trace to move positive or negative, while tilting forward or backward affects pitch. Rotating the drone around its vertical axis changes the yaw value, which is reflected both numerically and in the plotted yaw line. These changes appear smoothly in the plot, confirming that the fused state-estimator orientation data is being received and visualized correctly.
Document Index
Complete Project Code
"""Standalone IMU sensor test for the LiteWing drone.
This script connects to the drone, streams orientation and acceleration data, and
shows the readings on both the console and a simple Tk GUI with live plots.
"""
import threading
import time
from collections import deque
import tkinter as tk
import matplotlib
matplotlib.use("TkAgg")
from matplotlib.backends.backend_tkagg import FigureCanvasTkAgg
from matplotlib.figure import Figure
import cflib.crtp
from cflib.crazyflie import Crazyflie
from cflib.crazyflie.log import LogConfig
from cflib.crazyflie.syncCrazyflie import SyncCrazyflie
DRONE_URI = "udp://192.168.43.42"
LOG_PERIOD_MS = 50  # 20 Hz is sufficient for visualization
# Number of historical samples to retain for plotting (bounded memory usage)
HISTORY_LENGTH = 400
class IMUTestApp:
  """
  GUI application to visualize IMU / state estimator data from LiteWing.
  The class connects via the Crazyflie Python client, subscribes to logged
  variables (angles & acceleration), and displays them in a simple Tk GUI
  with runtime plots for recent samples. Data is streamed in a background
  thread and updates the GUI periodically without blocking user interaction.
  """
  def __init__(self, root: tk.Tk):
      self.root = root
      self.root.title("LiteWing IMU Test")
      self.root.geometry("1100x720")
      self.status_var = tk.StringVar(value="Status: Idle")
      self.roll_var = tk.StringVar(value="Roll: 0.00°")
      self.pitch_var = tk.StringVar(value="Pitch: 0.00°")
      self.yaw_var = tk.StringVar(value="Yaw: 0.00°")
      self.acc_var = tk.StringVar(value="Accel XYZ: 0.00, 0.00, 0.00 m/s²")
      self._build_controls()
      self._build_plot()
      self.stop_event = threading.Event()
      self.connection_thread: threading.Thread | None = None
      self.data_lock = threading.Lock()
      self.timestamps = deque(maxlen=HISTORY_LENGTH)
      self.roll_history = deque(maxlen=HISTORY_LENGTH)
      self.pitch_history = deque(maxlen=HISTORY_LENGTH)
      self.yaw_history = deque(maxlen=HISTORY_LENGTH)
      self.last_console_print = 0.0
      self.root.after(100, self._refresh_gui)
      self.root.protocol("WM_DELETE_WINDOW", self._on_close)
  def _build_controls(self) -> None:
      """Create the top control bar with Start/Stop buttons and status label."""
      top_frame = tk.Frame(self.root)
      top_frame.pack(fill=tk.X, padx=10, pady=6)
      tk.Button(top_frame, text="Start", command=self.start, bg="#28a745", fg="white", width=12).pack(side=tk.LEFT, padx=5)
      tk.Button(top_frame, text="Stop", command=self.stop, bg="#dc3545", fg="white", width=12).pack(side=tk.LEFT, padx=5)
      tk.Label(top_frame, textvariable=self.status_var, font=("Arial", 11, "bold"), fg="blue").pack(side=tk.LEFT, padx=20)
      value_frame = tk.Frame(self.root)
      value_frame.pack(fill=tk.X, padx=10, pady=6)
      tk.Label(value_frame, textvariable=self.roll_var, font=("Arial", 12)).pack(side=tk.LEFT, padx=10)
      tk.Label(value_frame, textvariable=self.pitch_var, font=("Arial", 12)).pack(side=tk.LEFT, padx=10)
      tk.Label(value_frame, textvariable=self.yaw_var, font=("Arial", 12)).pack(side=tk.LEFT, padx=10)
      tk.Label(value_frame, textvariable=self.acc_var, font=("Arial", 12)).pack(side=tk.LEFT, padx=10)
  def _build_plot(self) -> None:
      """Set up the matplotlib figure and axes for live plotting."""
      self.figure = Figure(figsize=(11, 6), dpi=100)
      self.axis = self.figure.add_subplot(1, 1, 1)
      # Plotting area for roll, pitch and yaw vs time. The plot uses a
      # single shared axis to keep orientation lines aligned so small
      # changes are easily visible.
      self.axis.set_title("Orientation (Roll/Pitch/Yaw)")
      self.axis.set_xlabel("Time (s)")
      self.axis.set_ylabel("Angle (°)")
      self.axis.grid(True, alpha=0.3)
      (self.roll_line,) = self.axis.plot([], [], label="Roll", color="tab:red")
      (self.pitch_line,) = self.axis.plot([], [], label="Pitch", color="tab:green")
      (self.yaw_line,) = self.axis.plot([], [], label="Yaw", color="tab:blue")
      self.axis.legend(loc="upper right")
      canvas = FigureCanvasTkAgg(self.figure, master=self.root)
      canvas.draw()
      canvas.get_tk_widget().pack(fill=tk.BOTH, expand=True, padx=10, pady=10)
      self.canvas = canvas
  def start(self) -> None:
      """Spawn the background connection worker thread if not already running."""
      # Prevent launching multiple background workers
      if self.connection_thread and self.connection_thread.is_alive():
          return
      self.stop_event.clear()
      # Start a daemon thread that will connect and manage log callbacks
      self.connection_thread = threading.Thread(target=self._connection_worker, daemon=True)
      self.connection_thread.start()
  def stop(self) -> None:
      self.stop_event.set()
  def _connection_worker(self) -> None:
      """Background worker that manages the Crazyflie connection and log streaming.

      This worker handles the radio connection, subscribes to IMU log variables,
      and calls _log_callback() for each incoming sample. Runs in a separate
      thread so the GUI remains responsive.
      """
      self._set_status("Status: Connecting...")
      try:
          # Initialize the Crazyradio drivers (disabling the debug radio by
          # default) so this machine can talk to the Crazyflie.
          cflib.crtp.init_drivers(enable_debug_driver=False)
          with SyncCrazyflie(DRONE_URI, cf=Crazyflie(rw_cache="./cache")) as scf:
              cf = scf.cf
              self._set_status("Status: Connected")
              # Create log config: orientation + acceleration variables
              # Specify the IMU variables we want to subscribe to from the CF
              log_config = LogConfig(name="IMUSensor", period_in_ms=LOG_PERIOD_MS)
              available_vars = [
                  ("stateEstimate.roll", "float"),
                  ("stateEstimate.pitch", "float"),
                  ("stateEstimate.yaw", "float"),
                  ("stateEstimate.ax", "float"),
                  ("stateEstimate.ay", "float"),
                  ("stateEstimate.az", "float"),
              ]
              # Add the requested log variables if present in firmware TOC
              if not self._add_variables_if_available(cf, log_config, available_vars):
                  self._set_status("Status: IMU variables unavailable")
                  return
              # Register callback to receive streaming log messages
              log_config.data_received_cb.add_callback(self._log_callback)
              cf.log.add_config(log_config)
              log_config.start()
              print("[IMU] Logging started")
              # Keep thread alive until stop_event is signaled by the GUI
              while not self.stop_event.is_set():
                  time.sleep(0.1)
              log_config.stop()
              print("[IMU] Logging stopped")
      except Exception as exc:  # noqa: BLE001
          print(f"[IMU] Connection error: {exc}")
          self._set_status("Status: Error - check console")
      finally:
          self._set_status("Status: Idle")
  def _add_variables_if_available(self, cf: Crazyflie, log_config: LogConfig, candidates: list[tuple[str, str]]) -> bool:
      """Check TOC and add requested variables if available on the aircraft.

      Prevents errors from attempting to subscribe to non-existent variables.
      """
      # Examine the Crazyflie Log TOC to check which variables are present on
      # the running firmware image.
      toc = cf.log.toc.toc
      added = 0
      for full_name, var_type in candidates:
          group, name = full_name.split(".", maxsplit=1)
          if group in toc and name in toc[group]:
              # Add the variable to the log request so it will be streamed
              # with the given period.
              log_config.add_variable(full_name, var_type)
              print(f"[IMU] Logging {full_name}")
              added += 1
          else:
              print(f"[IMU] Missing {full_name}")
      return added > 0
  def _log_callback(self, timestamp: int, data: dict, _: LogConfig) -> None:
      """Receive log packet and store values in history buffers.

      This callback is invoked on the worker thread when a new log sample
      arrives. We update the shared history buffers (under lock) so the GUI
      can read and plot them.
      """
      # Extract the latest sample from the log packet. When data isn't
      # present, default to zero so the GUI will show a neutral state.
      # NOTE: The angle units depend on the firmware; convert to degrees if
      # required before displaying.
      roll = data.get("stateEstimate.roll", 0.0)
      pitch = data.get("stateEstimate.pitch", 0.0)
      yaw = data.get("stateEstimate.yaw", 0.0)
      # Accelerations in m/s^2 as reported by the state estimator/IMU fusion
      ax = data.get("stateEstimate.ax", 0.0)
      ay = data.get("stateEstimate.ay", 0.0)
      az = data.get("stateEstimate.az", 0.0)
      # Append the sample to the buffers while holding a lock; _refresh_gui
      # will read from these buffers on the main thread to update the plot.
      with self.data_lock:
          now = time.time()
          self.timestamps.append(now)
          self.roll_history.append(roll)
          self.pitch_history.append(pitch)
          self.yaw_history.append(yaw)
          # Store all telemetry so the GUI top bar can access the latest values
          self.latest_values = (roll, pitch, yaw, ax, ay, az)
      # Periodically print compact telemetry to the console for debugging
      if time.time() - self.last_console_print >= 1.0:
          self.last_console_print = time.time()
          print(
              f"[IMU] Roll={roll:.2f}°, Pitch={pitch:.2f}°, Yaw={yaw:.2f}°, "
              f"Accel=({ax:.2f}, {ay:.2f}, {az:.2f}) m/s²"
          )
  def _refresh_gui(self) -> None:
      """Periodically update GUI elements and plots from history buffers.

      Called every 100 ms on the main Tk event loop. Reads history data
      under lock, then updates plot lines and axis limits.
      """
      # Periodically copy data from history buffers and update GUI elements
      # and plots; this function runs in the main Tk event loop.
      with self.data_lock:
          if getattr(self, "latest_values", None):
              # Update the status bar with the most recent values
              roll, pitch, yaw, ax, ay, az = self.latest_values
              self.roll_var.set(f"Roll: {roll:.2f}°")
              self.pitch_var.set(f"Pitch: {pitch:.2f}°")
              self.yaw_var.set(f"Yaw: {yaw:.2f}°")
              self.acc_var.set(f"Accel XYZ: {ax:.2f}, {ay:.2f}, {az:.2f} m/s²")
              times = list(self.timestamps)
              if times:
                  # Build a relative time axis (seconds since first sample)
                  t0 = times[0]
                  rel_times = [t - t0 for t in times]
                  # Copy the history lists for plotting to avoid holding the
                  # lock while matplotlib draws and to prevent race conditions.
                  roll_vals = list(self.roll_history)
                  pitch_vals = list(self.pitch_history)
                  yaw_vals = list(self.yaw_history)

                  # Update the plot lines (only data, not axes limits)
                  self.roll_line.set_data(rel_times, roll_vals)
                  self.pitch_line.set_data(rel_times, pitch_vals)
                  self.yaw_line.set_data(rel_times, yaw_vals)
                  # Keep a recent window of time visible for context (20 seconds)
                  last_time = rel_times[-1] if rel_times[-1] > 1 else 1
                  self.axis.set_xlim(max(0, last_time - 20), last_time + 1)
                  # Compute Y limits around the min/max angle values with some
                  # margin so the lines don't hug the axis.
                  all_vals = roll_vals + pitch_vals + yaw_vals
                  vmin = min(all_vals) if all_vals else -5
                  vmax = max(all_vals) if all_vals else 5
                  margin = max(5, (vmax - vmin) * 0.2)
                  self.axis.set_ylim(vmin - margin, vmax + margin)
                  self.canvas.draw_idle()
      self.root.after(100, self._refresh_gui)
  def _set_status(self, text: str) -> None:
      self.status_var.set(text)
  def _on_close(self) -> None:
      self.stop()
      self.root.after(200, self.root.destroy)
def main() -> None:
  root = tk.Tk()
  app = IMUTestApp(root)
  root.mainloop()
if __name__ == "__main__":