
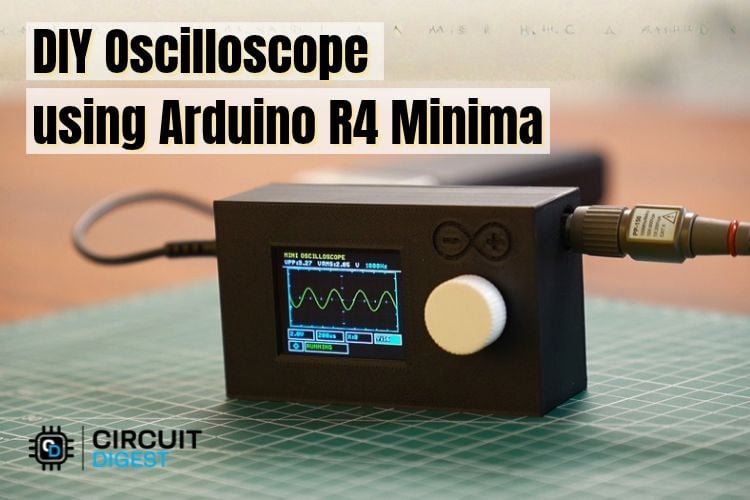
When working with electronics, a multimeter can tell you the voltage at a particular moment, but it cannot show you how that voltage changes over time. To observe these changes and understand what's happening inside a circuit, we need an oscilloscope. But instead of investing in a dedicated instrument, what if we could build a simple one ourselves using a microcontroller and a few readily available components? That's exactly what we're going to do in this project.
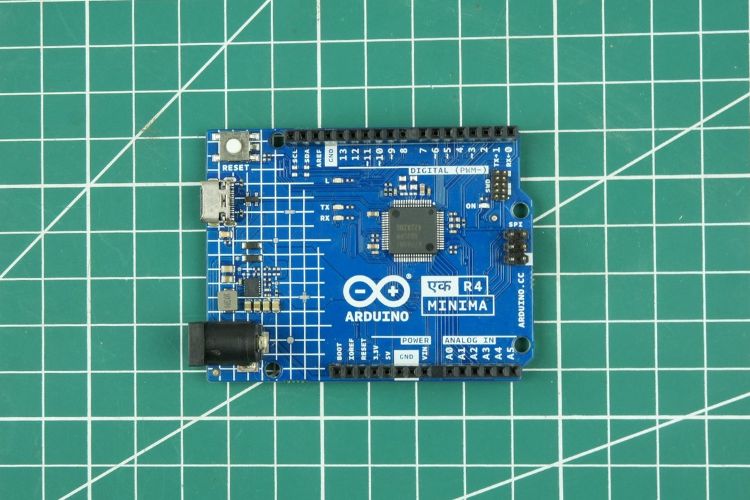
At the heart of this build is the Arduino UNO R4 Minima, paired with a 1.8-inch TFT display, a rotary encoder, and a voltage divider circuit. The oscilloscope can measure positive input voltages from 0 to 10V, display waveforms in real time, and calculate parameters such as peak-to-peak voltage, RMS voltage, and signal frequency. We have also designed a custom 3D-printed enclosure to house the components, making it a compact tool for basic signal testing and experimentation. You can also check out similar Arduino Projects done previously here at Circuit Digest.
Working Principle of an Oscilloscope
An oscilloscope works by measuring how an electrical signal changes over time and displaying those changes as a waveform. The vertical axis represents the voltage, while the horizontal axis represents time. This allows us to observe the shape of a signal, identify voltage variations, and measure parameters such as amplitude, frequency, and time period.
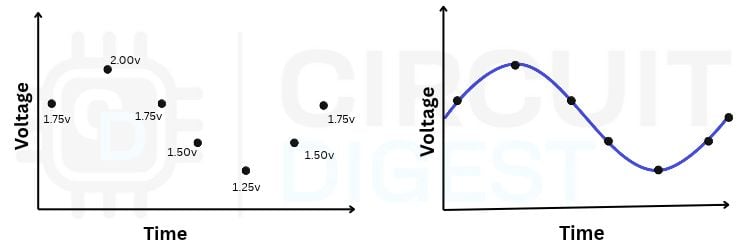
In a digital oscilloscope, the input signal is sampled at regular intervals using an analog-to-digital converter (ADC). These samples are converted into digital values and processed to generate the waveform on the display. The quality of the displayed waveform depends on several factors, including the ADC resolution, sampling rate, input voltage range, and frequency of the signal being measured.
We can apply the same principle using a microcontroller. By reading an analog signal through its ADC, storing a series of samples, and plotting those values against time, we can create a basic digital oscilloscope. However, the microcontroller must sample the signal quickly enough to capture its variations accurately.
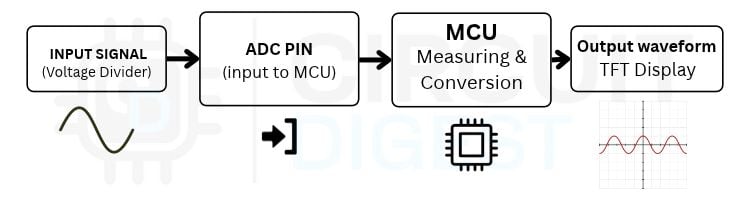
In our project, the Arduino UNO R4 Minima reads the input voltage through a voltage divider, processes the sampled values, and displays the resulting waveform on a TFT screen. Before building the complete circuit, we can verify this working principle by connecting the Arduino to a voltage divider, applying a test signal, and observing the readings in the Arduino IDE Serial Plotter.
Components Required
Before we start building the DIY oscilloscope, let's gather all the components needed for the project. The setup uses the Arduino UNO R4 Minima as the main controller, along with a TFT display to visualize the waveforms and a rotary encoder to adjust the display parameters. A few resistors are used to build the input voltage divider, while a BNC connector provides a convenient interface for connecting the input signal.
The following table lists the components and their specifications required to build this project.
S.No | Components | Specification | Quantity |
| 1. | Microcontroller | Arduino Uno R4 Minima | 1 |
| 2. | TFT display | 2.0" ILI9225 SPI TFT display | 1 |
| 3. | Rotary Encoder | HW-040(KY-040) | 1 |
| 4. | Resistors | 15 kΩ | 1 |
| 10 kΩ | 1 | ||
| 1 kΩ | 1 | ||
| 5. | BNC Female Connector | Right Angle PCB Mount | 1 |
Circuit Diagram and Connections
The circuit for our DIY oscilloscope is simple and uses only a few components. The Arduino UNO R4 Minima acts as the main controller, interfacing with the TFT display and rotary encoder. A resistor-based voltage divider is used at the input to scale down the incoming signal before it reaches the Arduino's analog pin.
The circuit diagram below shows how all the components are connected. Follow the connections carefully while assembling the circuit, paying particular attention to the voltage divider and input signal connections.

Below table is the wiring of Encoder with Minima
| Encoder Pin | Uno Minima pin |
| CLK | D2 |
| DT | D3 |
| SW | D4 |
| VCC | 5V |
| GND | GND |
Below table is the wiring of TFT display with Minima
| TFT Display Pin | Uno Minima Pin |
| VCC | 5V |
| GND | GND |
| GND | GND |
| CLK | D13 |
| SDA | D11 |
| RS | D6 |
| RST | D7 |
| CS | D8 |
Once the circuit is assembled and tested, let's move on to the enclosure design. We designed a simple 3D-printed enclosure to fit the display, rotary encoder, and other components, with the Arduino and remaining electronics housed inside.
Designing the 3D-Printed Enclosure
We also designed a simple, compact enclosure for the oscilloscope to house all the components in one unit. The TFT display and rotary encoder are mounted on the front, while the Arduino UNO R4 Minima and the rest of the electronics are assembled inside.
We have also provided openings for the USB Type-C port and DC jack for power input, along with a BNC connector to connect the input signal. Below is the 3D model of the enclosure we designed for this project.
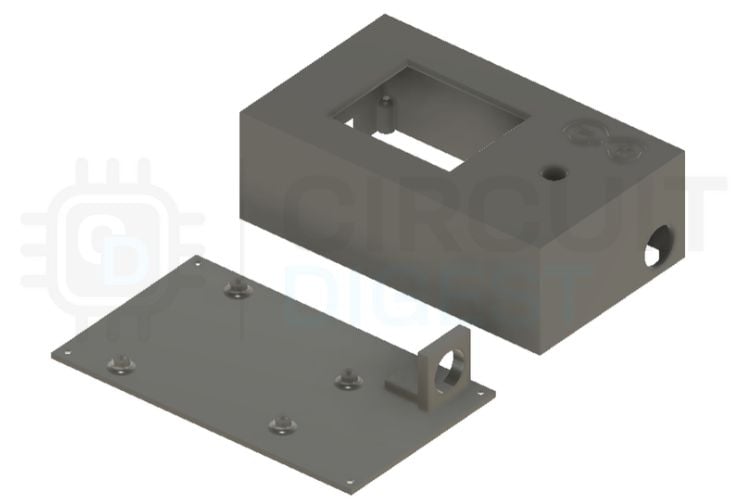
After designing the enclosure, we 3D-printed it and assembled all the components inside. The TFT display and rotary encoder are mounted on the front, while the Arduino and the rest of the circuit are housed inside. We also added the BNC connector and power input connections to complete the build.
Here is the final prototype of our DIY oscilloscope.
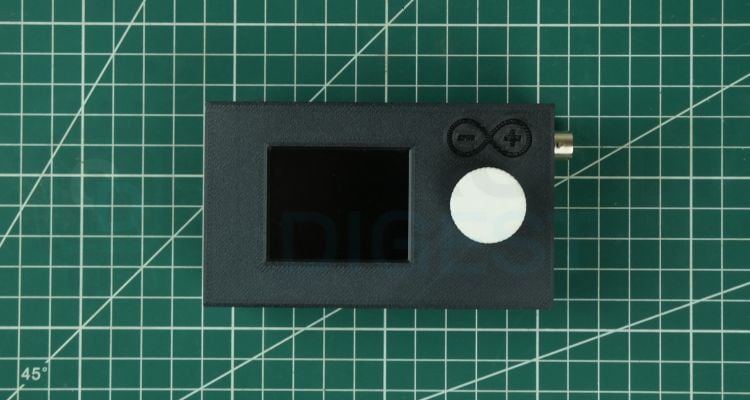
The above image is the final prototype of our DIY oscilloscope. I've also included the 3D enclosure files in the GitHub repository, so you can find the link below the article and print your own enclosure.
Code Explanation
The Arduino sketch handles signal sampling, waveform display, and measurement calculations, along with the rotary encoder controls. Let's take a quick look at how the code captures the input signal, processes the readings, and displays the results on the TFT screen.
The program first initializes the display, input pins, and rotary encoder. It then captures 128 samples from the analog input, calculates the peak-to-peak voltage, RMS voltage, and signal frequency, and draws the waveform on the display. The rotary encoder is used to adjust the voltage scale, time base, and waveform position, while a long press freezes or resumes the display.
void captureFrame()
{
  if (paused)
    return;
  long targetSampleIntervalUs =
    timeDivPresetsUs[timeDivIndex] / 16;
  long delayUs =
    targetSampleIntervalUs - 4;
  if (delayUs < 0)
    delayUs = 0;
  uint16_t minAdc = 1023;
  uint16_t maxAdc = 0;
  uint32_t sumAdcSquared = 0;
  unsigned long startTime = micros();
  for (uint8_t i = 0; i < BUF_LEN; i++)
  {
    uint16_t raw =
      analogRead(PIN_SCOPE_INPUT);
    sampleBuf[i] =
      raw >> 2;
    if (raw < minAdc)
      minAdc = raw;
    if (raw > maxAdc)
      maxAdc = raw;
    sumAdcSquared +=
      (uint32_t)raw * raw;
    if (delayUs > 0)
      delayMicroseconds(delayUs);
    // Poll the inputs inside the capture loop periodically to avoid lag
    if (i % 16 == 0)
    {
      handleInputs();
    }
  }
  unsigned long totalTimeUs =
    micros() - startTime;
  float actualSampleRateUs =
    (float)totalTimeUs / BUF_LEN;
The above function captures 128 samples from the input signal through the Arduino's analog pin. It calculates the minimum and maximum ADC readings and accumulates the squared readings for RMS voltage calculation. The sampling interval is adjusted according to the selected time scale. It also periodically checks user inputs to keep the rotary encoder responsive and measures the actual time taken to capture the samples.
// ----------------------------------
  // Frequency Detection
  // ----------------------------------
  uint8_t minVal =
    minAdc >> 2;
  uint8_t maxVal =
    maxAdc >> 2;
  float midAdc =
    minVal +
    ((maxVal - minVal) / 2.0);
  float firstCross = -1.0;
  float lastCross = -1.0;
  uint8_t edgesFound = 0;
  for (
    uint8_t i = 0;
    i < BUF_LEN - 1;
    i++
  )
  {
    if (
      sampleBuf[i] < midAdc &&
      sampleBuf[i + 1] >= midAdc
    )
    {
      float dy =
        (float)(
          sampleBuf[i + 1] -
          sampleBuf[i]
        );
      float exactCross;
      if (dy > 0)
      {
        exactCross =
          (float)i +
          (
            midAdc -
            sampleBuf[i]
          )
          / dy;
      }
      else
      {
        exactCross = i;
      }
      if (firstCross < 0)
      {
        firstCross =
          exactCross;
      }
      lastCross =
        exactCross;
      edgesFound++;
    }
  }
  if (
    edgesFound >= 2 &&
    signalVpp > 0.4
  )
  {
    float totalCycles =
      edgesFound - 1;
    float avgPeriodSamples =
      (lastCross - firstCross)
      / totalCycles;
    float periodSec =
      (
        avgPeriodSamples *
        actualSampleRateUs
      )
      / 1000000.0;
    if (periodSec > 0)
    {
      signalFreq =
        1.0 / periodSec;
    }
    else
    {
      signalFreq = 0;
    }
  }
  else
  {
    signalFreq = 0;
  }
}
This code calculates the signal frequency by first finding the midpoint between the minimum and maximum ADC values, which acts as the crossing threshold. It then scans the 128 samples to detect rising-edge crossings where the signal moves from below the midpoint to above it. Using linear interpolation, it estimates the exact crossing position between two samples for better accuracy.
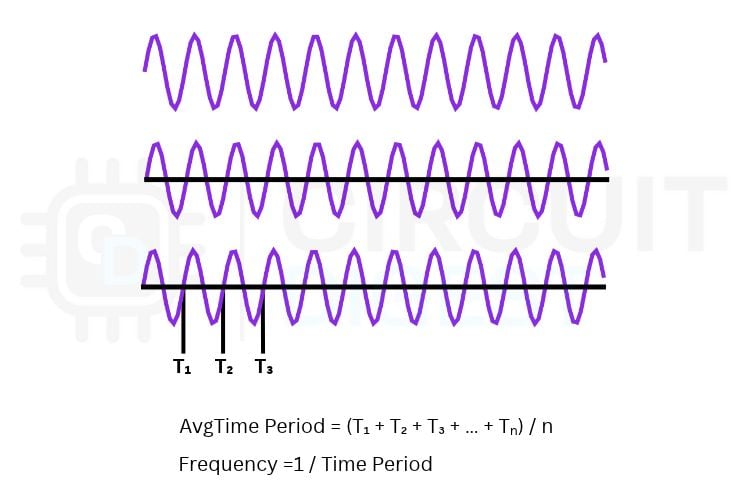
The algorithm measures the distance between the first and last crossings and divides it by the number of cycles to calculate the average period. It then converts this period into seconds using the actual sampling interval and calculates the frequency in Hz by taking its reciprocal. Finally, it checks that at least two rising-edge crossings are detected and the signal amplitude is above 0.4 V; otherwise, the frequency is set to 0 Hz to avoid unreliable readings.
Working Demo
Now that we’ve looked at how the circuit works and how the code captures the signal, let’s put it to the test. We’ll connect different input signals, adjust the voltage and time scales, and see how accurately our Arduino oscilloscope can display the waveforms in real time.
For testing, we used a signal generator and tried different types of input signals, including sine waves, PWM signals, and several other waveforms. The oscilloscope was able to capture and display them clearly on the screen. Seeing it work so well with different signals was really satisfying, especially for a DIY build like this!
Limitations and Possible Improvements
One of the main limitations we noticed is the sampling speed. As we increase the input frequency, the waveform starts to break down due to aliasing, because the Arduino cannot sample fast enough to accurately capture the signal. This can be improved using techniques like direct ADC register access and DMA-based sampling, which can increase the sampling speed.
Another limitation is that this oscilloscope can measure only positive voltages within the Arduino's input range of 0–5V. Applying negative voltages directly can damage the board. To measure AC signals, we can add a level-shifting circuit that shifts the waveform into the safe positive voltage range, allowing the Arduino to sample it and the software to reconstruct the original waveform.
These improvements can make the oscilloscope more capable, but even in its current form, it's a useful tool for checking PWM signals, monitoring sensor outputs, and debugging basic circuits on your workbench.



Add a comment
No account needed. Your comment appears once a moderator has reviewed it.