

Graphical representation is always helpful to visualize the data and it becomes very easy to find trends and patterns by looking at them. There are many software available to plot graphs based on the input values, but in embedded system MATLAB is one of the most popular software which can not only present the results in graphical format but also can be easily integrated with hardware and microcontrollers.
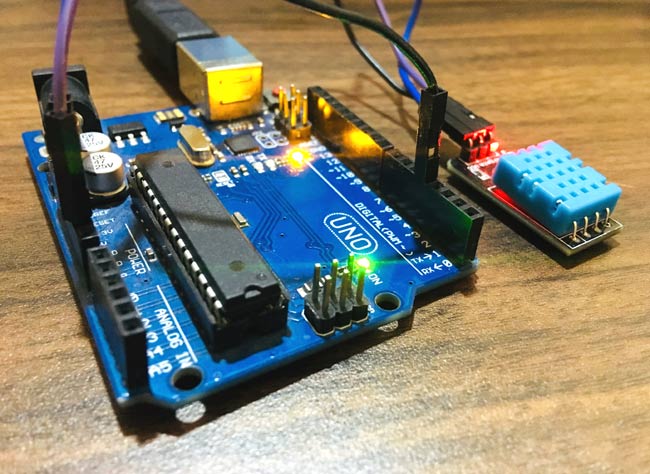
In this tutorial we will learn how to log and present the data in graphical format using MATLAB. Here we log the real time temperature and humidity data from DHT11 using Arduino and MATLAB. We previously used LM35 with MATLAB to plot the temperature graph.
If you are new to MATLAB you can check our previous MATLAB tutorials for better understating:
- Getting started with MATLAB: A Quick Introduction
- Interfacing Arduino with MATLAB - Blinking LED
- DC Motor Control Using MATLAB and Arduino
- Serial Communication between MATLAB and Arduino
- Getting Started with Image Processing using MATLAB
You can refer all the MATLAB Tutorial here.
Components Required
- MATLAB Installed Laptop (version above or R2016b)
- Arduino UNO
- DHT11 Temperature and Humidity Sensor
Circuit Diagram

Arduino Code for DHT11 interfacing with MATLAB
After connecting DHT11 sensor with Arduino, upload the code into Arduino using Arduino IDE. The complete Arduino code for logging and visualizing temperature and humidity data into MATLAB is given at the end. Let’s understand how the code is working.
First include the library for DHT11 sensor which is ‘DHT.h’.
#include <DHT.h>
Then define the DHT11 data pin connected to the Arduino. In our case, it is pin number 4.
#define DHTPIN 4
In the ‘void setup’ initialize the serial and the DHT11 sensor.
void setup() {
  Serial.begin(9600);
  delay(2000);
  dht.begin();   // initialise DHT11 sensor
}
In the ‘void loop’ function, set the value of temperature and humidity as float type. Read the temperature and humidity data from the Arduino using command float temp = dht.readTemperature() and float humi = dht.readHumidity(). Then print these values on the serial monitor, so that the MATLAB will be able to read the values serially.
void loop() {
  float temp = dht.readTemperature();   //read temperature data
float humi = dht.readHumidity();   //read temperature data
 Serial.print(temp);
  Serial.print(humi);
  delay(2000);
}
MATLAB Code for Logging and Plotting the Data
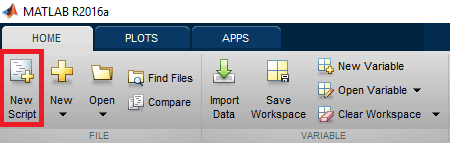
Open MATLAB in your system, and starting coding in the editor window. The editor window can be opened by clicking on the ‘new script’ in MATLAB, as shown in the below image.
The complete MATLAB code for DHT11 sensor data logging is given at the end of the project.
Start with defining a variable for the serial communication from MATLAB to Arduino. COM18 is the port at which my Arduino is connected, you can change accordingly.
s = serial('COM18');
In the below code, fopen() is used for serial communication between Arduino and MATLAB. Then we are saving the serial data into variable called ‘out’. The out variable is a string of nine digits where the first four digits stores the temperature data and the remaining digits stores humidity data. So, by using Temp(i)=str2num(out(1:4)) and Humi(i)=str2num(out(5:9)) we are reading the temperature and humidity data respectively.
fopen(s)
out = fscanf(s)
Temp(i)=str2num(out(1:4));
Humi(i)=str2num(out(5:9));
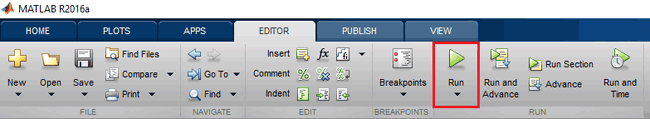
Now, after pasting the complete code into the editor window. Click on the ‘run’ button to process the code, as shown in the below image.
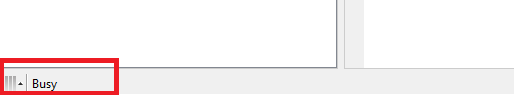
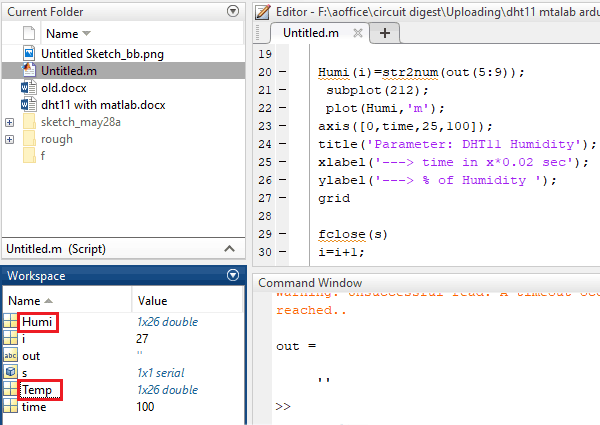
Wait until the MATLAB shows busy in the bottom left corner of the screen, as shown in the below image. This indicated that the MATLAB is processing the code.
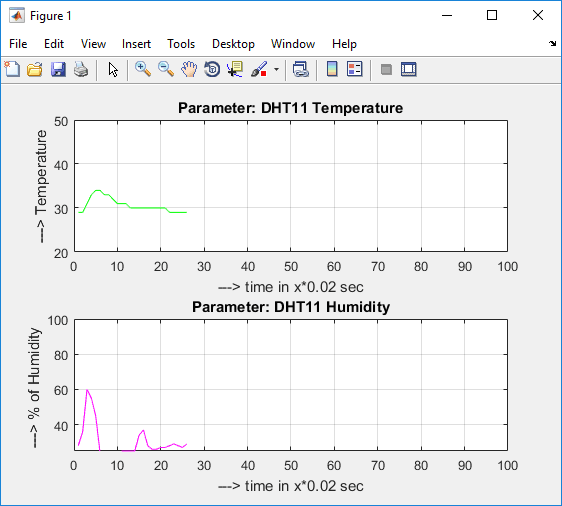
If the code executes without any error, the real-time graph window will appear on the screen, as shown below. Here, the data will update in every two seconds, as two seconds is the time taken by the DHT11 sensor to send the data to the serial port.
To check the real-time logged value of temperature and humidity, double click on the respective variable in the workspace window, as shown in the below image.
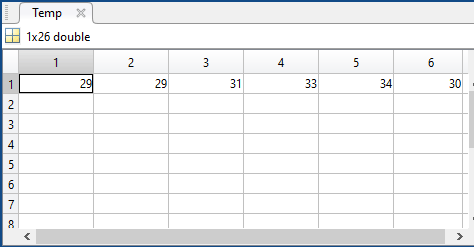
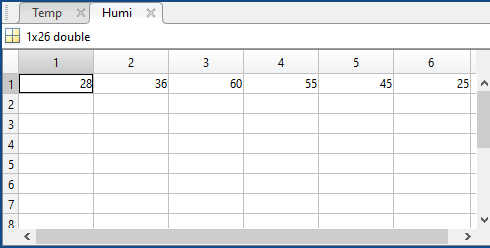
The dialog box will appear which contains all the saved values into the particular variable.
So this is how you can log, visualize and plot graphs based on any data using the MATLAB.
Complete Project Code
Arduino Code
#include <DHT.h>
#define DHTPIN 4                                                           #define DHTTYPE DHT11


DHT dht(DHTPIN, DHTTYPE);
void setup() {

  Serial.begin(9600);

  delay(2000);

  dht.begin();   // initialise DHT11 sensor

}
void loop() {

  float temp = dht.readTemperature();   //read temperature data

float humi = dht.readHumidity();   //read temperature data

 Serial.print(temp);

  Serial.print(humi);

  delay(2000);

}

MATLAB Code
s = serial('COM18');

time=100;

i=1;

while(i<time)
fopen(s)

fprintf(s, 'Your serial data goes here')

out = fscanf(s)
Temp(i)=str2num(out(1:4));

 subplot(211);

 plot(Temp,'g');

 axis([0,time,20,50]);

title('Parameter: DHT11 Temperature');

xlabel('---> time in x*0.02 sec');

ylabel('---> Temperature');

grid

Humi(i)=str2num(out(5:9));

 subplot(212);

 plot(Humi,'m');

axis([0,time,25,100]);

title('Parameter: DHT11 Humidity');

xlabel('---> time in x*0.02 sec');

ylabel('---> % of Humidity ');

grid
fclose(s)

i=i+1;

drawnow;

end

delete(s)

clear s

Hi, i try to make this project but i don't know where i'm wrong.
I pasted the matlab code but i get this error:
"Unable to perform assignment because the indices on the left
side are not compatible with the size of the right side.
Error in Untitled (line 10)
Temp(i)=str2num(out(1:4));"
and the graphs no longer appear.
I mention that I'm at the beginning with arduino and matlab.
I would be very grateful if anyone can help me.