

Graphs are always helpful to visualize the data and it becomes very easy to find trends and patterns by looking at them. There are many software available to plot graphs based on the input values, today we will use MATLAB to plot graph based on the temperature data from LM35 sensor. This tutorial will give you a basic idea about how to plot real time graph using MATLAB. Arduino Uno is used here to get temperature data from LM35 temperature sensor.
Before proceeding further, if you are new to MATLAB you can check our previous MATLAB tutorials for better understating:
- Getting started with MATLAB: A Quick Introduction
- Interfacing Arduino with MATLAB - Blinking LED
- Serial Communication between MATLAB and Arduino
- DC Motor Control Using MATLAB and Arduino
- Stepper Motor Control using MATLAB and Arduino
Creating MATLAB Graphical User Interface for Plotting Graph
First we have to build GUI (Graphical User Interface) for Plot a Graph with the temperature data. To launch the GUI, type the below command in the command window
guide
A popup window will open, then select new blank GUI as shown in below image,

Now we have to choose one push button, two axes and one text box for MATLAB graphical interface. Push button will be used for start the temperature sensing, two axes for plotting the graph and Text box to show the current value of temperature.
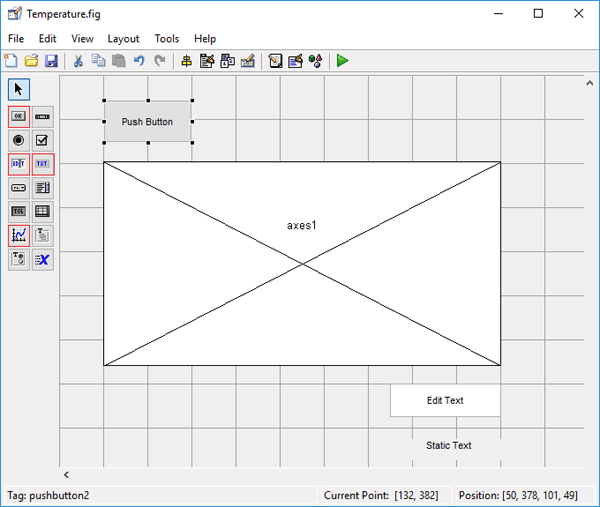
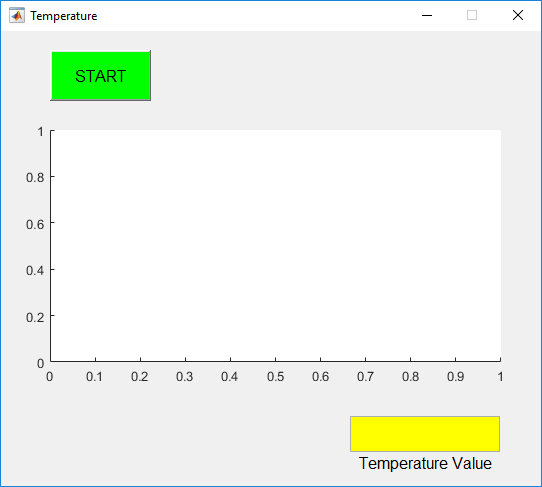
To resize or to change the shape of the button, Axes or edit text button, just click on it and you will be able to drag the corners of the button. By double-clicking on any of these you will be able to change the color, string and tag of that particular button. After customization it will look like this
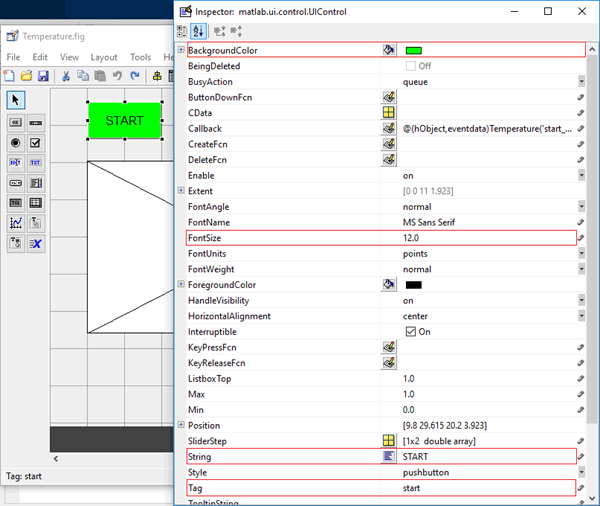
You can customize the buttons as per your choice. Now when you save this, a code is generated in the Editor window of MATLAB. To make your Arduino to perform any particular task related to your project, you always have to edit this generated code. So below we have edited the MATLAB code. You can learn more about Command window, editor window etc in Getting started with MATLAB tutorial.
MATLAB Code for Plotting the Graph
Complete MATLAB code for Designing a Thermometer using LM35 and Arduino, is given at the end of this project. Further we are including the GUI file (.fig) and code file(.m) here for download, using which you can customize the buttons or Axes size as per your requirement. We have edited the generated code as explained below.
Copy and paste the below code on line no. 74 to make sure that the Arduino is talking with MATLAB every time you run the m-file.
clear all;
global a;
a = arduino();

When you scroll down, you will see that there are two functions created for Pushbutton and Edit Text in the GUI, no function will be created for Axes. Now write the code in the Pushbutton (start button) function according to the task you want to perform.
In Start button’s function, copy and paste the below code just before the ending of the function to start the temperature sensing. For continuously sensing, displaying and graphical plotting of the temperature, we are using while loop. We have provided pause of 1 second after every iteration so temperature value will be updated every second.
x = 0;
go = true;
global a;

while go
value = readVoltage(a,'A1');
temp = (value*100);
disp(temp);
x = [x temp];
plot(handles.axes1,x);
grid on;
xlabel('Time(seconds)')
ylabel('Temperature(°C)');
title('Real-Time Temperature Graph');
drawnow
set(handles.edit1,'String',num2str(temp));
pause(1);
end

Now, lets see how the code is working. In below three lines line we have set the initial value of ‘x’ to zero, defining ‘go’ as true to start the while loop and declared ‘global a’ for calling the Arduino in the function.
x = 0;
go = true;
global a;
Below line of code is used to sense the voltage value from the analog pin A1 of the Arduino which is connected to the ‘OUT’ pin of the LM35 Temperature Sensor. The output will be the voltage value not the analog value.
value = readVoltage(a,'A1');
Here we can directly convert the voltage value into the temperature value (degree Celsius), by multiplying it by 10
temp = (value*100);
Now, to plot the graph ‘plot(handles.axes1,x)’ function is used, where axes1 is the reference or name of the Graph area. So if you are plotting more than one graph then you just have to change the name of the axes, like if you plot another graph you can write plot(handles.axes2,x)’
‘Grid on’ is used to On the Grid view of the graph, ‘xlabel’, ‘ylabel’ and ‘title’ are used for naming the x-axis, y-axis and title.
plot(handles.axes1,x);
grid on;
xlabel('Time(seconds)')
ylabel('Temperature(°C)');
title('Real-Time Temperature Graph');
‘Drawnow’ is used to update the graphical representation in real-time.
drawnow
To display the value of the temperature in the edit text box at every second below command is used,
set(handles.edit1,'String',num2str(temp));
Material Required
- MATLAB installed Laptop (Preference: R2016a or above versions)
- Arduino UNO
- LM35 – Temperature Sensor
- Connecting Wires
- Breadboard
Circuit Diagram

Plot the Graph with MATLAB
After setting the hardware according to circuit diagram, just click on the run button to run the edited code in .m file

MATLAB may take few seconds to respond, do not click on any GUI buttons until MATLAB is showing busy message in the lower left corner as shown below,

When everything is ready, click on the start button and you will start getting the temperature data on the Graphical Area and in the Edit Text box. The value will automatically update in every one second. This interval of one second you can change in the MATLAB code accordingly.
The output will look like the image shown below,
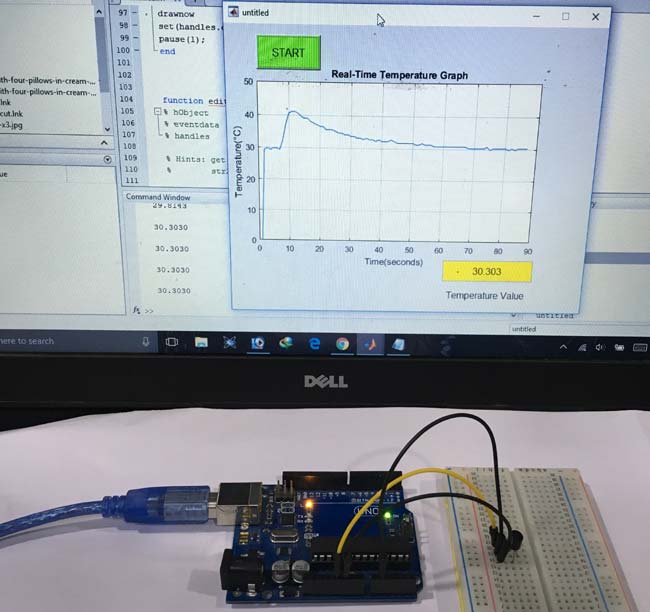
This is how you can plot the graph for any incoming value from the Arduino using MATLAB.
Check the demonstration video below for proper understanding.
Complete Project Code
MATLAB Code:
function varargout = Temperature(varargin)
gui_Singleton = 1;

gui_State = struct('gui_Name',       mfilename, ...

                   'gui_Singleton',  gui_Singleton, ...

                   'gui_OpeningFcn', @Temperature_OpeningFcn, ...

                   'gui_OutputFcn',  @Temperature_OutputFcn, ...

                   'gui_LayoutFcn',  [] , ...

                   'gui_Callback',   []);

if nargin && ischar(varargin{1})

    gui_State.gui_Callback = str2func(varargin{1});

end
if nargout

    [varargout{1:nargout}] = gui_mainfcn(gui_State, varargin{:});

else

    gui_mainfcn(gui_State, varargin{:});

end
function Temperature_OpeningFcn(hObject, eventdata, handles, varargin)
handles.output = hObject;
guidata(hObject, handles);

function varargout = Temperature_OutputFcn(hObject, eventdata, handles)
varargout{1} = handles.output;

clear all;

global a;

a = arduino;
function start_Callback(hObject, eventdata, handles)
x = 0;

go = true;

global a;

while go


value = readVoltage(a,'A1');

temp = (value*100);

disp(temp);

x = [x temp];

plot(handles.axes1,x);

grid on;

xlabel('Time(seconds)')

ylabel('Temperature(°C)');

title('Real-Time Temperature Graph');

drawnow

set(handles.edit1,'String',num2str(temp));

pause(1);

end

function edit1_Callback(hObject, eventdata, handles)

function edit1_CreateFcn(hObject, eventdata, handles)
if ispc && isequal(get(hObject,'BackgroundColor'), get(0,'defaultUicontrolBackgroundColor'))

    set(hObject,'BackgroundColor','white');

end

Hello sir,I am trying to display real time data on GUI.I am able to display graph of real time data in MATLAB successfully but not in GUI. Can you please help me. Instead of temperature sensor i am using STM32 controller.
Thank you.