Electrical energy is no longer treated as an unlimited utility. Every watt consumed has a cost impact, an efficiency implication, and in many cases a safety consequence. A smart grid in IoT is not a complicated buzzword. It simply means that electrical infrastructure is monitored continuously, data is collected in real time, and decisions are made based on measured values instead of guesswork. When voltage, current, power, and energy are tracked, loads can be balanced, abnormal consumption can be detected early, and equipment damage can be prevented.
At home, this enables appliance-level energy tracking and lower bills. In small industries, it supports load analysis and preventive maintenance. In labs and workshops, it helps validate designs safely. In addition to local monitoring, long-term data storage and visualization are equally important. Sending measurements to a cloud platform such as ThingSpeak allows historical trends to be recorded, graphs to be generated automatically, and systems to be observed remotely from anywhere. This makes the monitoring node more than just a meter and turns it into a practical IoT instrument. Understanding the importance of the smart grid in IoT becomes clear when you consider the breadth of applications it covers. At home, it enables appliance-level energy tracking and lower electricity bills.
This IoT smart energy grid project walks through building a simple but practical smart grid monitoring node using an Arduino UNO R4 WiFi and the PZEM 004T energy meter. The objective is clarity and reliability, not complexity. The system reads electrical parameters, displays them locally on an OLED screen, and uploads the data to the cloud for remote monitoring and analysis. If you're interested in more Arduino-based projects, do check out our Arduino Projects Collection.
IoT Smart Grid Project – Quick Overview
- Main Controller: Arduino UNO R4 WiFi (Renesas RA4M1, built-in WiFi)
- Energy Meter Module: PZEM-004T (Modbus RTU over UART)
- Parameters Measured: Voltage, Current, Power, Energy, Frequency, Power Factor
- Local Display: I2C OLED (128×64, address 0x3C)
- Cloud Platform: ThingSpeak (free, 6-field channel)
- Communication: Modbus RTU (PZEM ↔ Arduino) + WiFi (Arduino ↔ Cloud)
- Architecture: Edge-to-Cloud (sense → process → display → upload)
Table of Contents
What Is a Smart Grid in IoT?
An IoT smart grid is a network for distributing electricity that integrates sensors, microcontrollers, and cloud-based analytics. The smart grid devices constantly measure voltage, current, frequency, and power factor every second via telephone-style (wired and wireless) communication with a central computing system. This allows operators to monitor electricity flow 24/7, receive alerts on abnormal operating conditions, modify electricity distribution patterns based upon consumer usage history, and generate reports on past usage trends.
| Parameter | Unit | What It Indicates | Typical Single-Phase Range |
| Voltage | V | Supply quality and stability | 220–240 V (IN/EU) | 110–120 V (US) |
| Current | A | Load demand and wire thermal stress | 0–100 A (PZEM-004T range) |
| Real Power | W | Actual useful work performed | 0–23,000 W |
| Energy | kWh | Accumulated electricity consumed | 0–9999.99 kWh |
| Frequency | Hz | Grid stability | 45–65 Hz |
| Power Factor | PF | Efficiency of the current conversion to work | 0.00–1.00 |
Importance of Smart Grid in IoT
The importance of smart grid in IoT has three major advantages over a conventional electric distribution system: energy conservation, protection of equipment, and operational efficiency. The importance of the smart grid in IoT spans energy efficiency, equipment safety, and operational intelligence.
A conventional electric meter will only provide an end-of-month reading of total usage. An Internet of Things-enabled smart grid provides real-time (to the second) granular data that not only reveals consumption trends that would otherwise be hidden, but also identifies appliances that are defective and drawing excessive current, and also identifies when voltage sags or surges may damage connected devices. In countries such as India, where the grid is subject to constant voltage fluctuations and the supply voltages can vary from 180 to 250 volts in the same location, real-time monitoring for voltage will help mitigate damage to equipment that often far exceeds the cost of the monitoring system.
The additional savings to industry are even greater than those to residential customers. The fact that power factor can be measured continuously allows industries to identify specific motors or capacitor banks that are operating inefficiently, which reduces penalties for low power factor (PF) by utilities. Demand-side management will also be possible by using real-time data on load, which will facilitate load shedding and peak demand schedules. For solar energy users, the ability to monitor generation and consumption in real-time through an IoT-enabled smart grid will allow users to achieve balance in generation and consumption. The improvements described are quantifiable in measurement and dollar terms and justify every cost associated with the components of this project. For solar energy users, a smart grid IoT system can balance generation against consumption in real time, optimising battery charging and grid export decisions.
Key Benefits of Smart Grid in IoT
∗ Real Time Visibility - real-time information allows for accurate real-time measurements instead of the standard end-period measurements found in monthly meter readings
∗ Voltage Protection - allows for immediate notification of voltages that exceed safe operating limits
∗ Overcurrent Detection - identifies bad appliances and overloaded circuits before they cause damage to the property or equipment
∗ Power Factor Correction - allows identify and reduction of utility penalties for inefficient loads
∗ Remote Monitoring - logging of data in the cloud allows for logging from any location using any device
∗ Historical Trend Analysis - allows for historical energy usage and billing audits using long-term data
∗ Predictive Maintenance - identifies patterns and trends in equipment degradation before equipment failure by assessing abnormal values
∗ Solar Optimisation - analyse renewable energy generation against actual consumption in real-time
Fundamentals of the Electrical Grid
Before connecting hardware, it is worth understanding what is being measured. Most residential and small commercial systems use a single-phase AC supply. The mains voltage alternates sinusoidally at either 50 Hz or 60 Hz. This alternating nature means that both magnitude and phase matter. Voltage represents an electrical potential difference. It can be visualised as the pressure that pushes current through a load. If the voltage rises too high, devices may fail. If it drops too low, the motors overheat, and electronics behave unpredictably. Current represents the actual flow of charge. Higher current means more stress on wires and components. Excess current is the primary cause of overheating and fire risk.
Power is the rate at which energy is consumed. Real power, measured in watts, is what actually performs useful work. This is what appears on your electricity bill. Energy is the accumulated power over time and is measured in kilowatt-hours. This value answers the practical question of how much electricity has been used. Frequency indicates how stable the grid is. Significant deviation from nominal frequency often indicates system stress or imbalance. Power factor describes how efficiently current is being converted into useful work. A poor power factor results in wasted capacity and higher losses. Monitoring these parameters provides a complete picture of electrical health.
Understanding the PZEM 004T Energy Meter
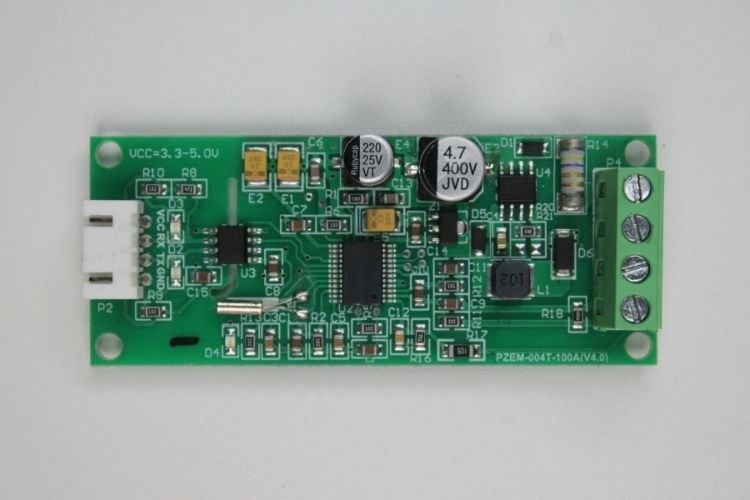
The PZEM 004T is a compact digital energy meter module designed for embedded applications. It combines voltage sensing, current measurement, and internal signal processing on one board. Voltage is measured using an internal resistor divider connected across the AC line. Current is measured through an external current transformer. The transformer clamps around a single conductor and senses magnetic flux, which provides isolation and improves safety. All measurement complexity is encapsulated inside the PZEM module, significantly reducing development time and firmware complexity for any IoT-based smart grid system.
Inside the module, an energy metering IC samples voltage and current waveforms, computes RMS values, calculates real power, integrates energy, and determines frequency and power factor. Communication is handled using Modbus RTU over UART. This is important. Instead of dealing with analogue signals or calibration, a microcontroller simply sends a request frame and receives measured values digitally. The complexity is abstracted away. For embedded systems work, this reduces design time significantly. This range covers both Indian/European 230 V circuits and North American 120 V supplies, making the module suitable for global deployments of a smart grid IoT system.
| Specification | Value |
| Voltage measurement range | 80 – 260 V AC |
| Current measurement range | 0 – 100 A AC (via CT clamp) |
| Active power range | 0 – 23,000 W |
| Energy accumulation | 0 – 9999.99 kWh |
| Frequency range | 45 – 65 Hz |
| Power factor range | 0.00 – 1.00 |
| Communication protocol | Modbus RTU over UART, 9600 baud, 8N1 |
| Logic supply voltage | 5 V DC |
| Voltage measurement accuracy | plusmn;0.5% |
| Current measurement accuracy | plusmn;0.5% |
Making the IoT-Based Smart Grid Monitoring System
After understanding how the PZEM 004T measures electrical parameters, the next step is integrating it into a complete IoT node. The goal is simple. Capture data, process it, display it, and make it accessible remotely. The mains line is connected to the PZEM for voltage sensing, while the current transformer is clamped around the live conductor. The module internally computes RMS voltage, current, power, energy, frequency, and power factor. No complex analog design or calibration is required at the controller level.
These values are read digitally by the Arduino UNO R4 WiFi over UART using Modbus RTU. This shifts the problem from signal processing to clean data handling, which simplifies firmware design and improves reliability. Once received, the data is shown locally on an OLED display for instant visibility. At the same time, readings are transmitted over WiFi to ThingSpeak for logging and visualization. This provides both on-site monitoring and remote access. The result is a compact IoT-based smart grid system using Arduino that senses locally and reports centrally. The architecture stays modular, easy to debug, and easy to expand with additional meters or analytics later.
Components Required to Build the Smart Grid in IoT
The image below shows the visual images of components used in the making of the Smart Grid Monitoring System Using IoT
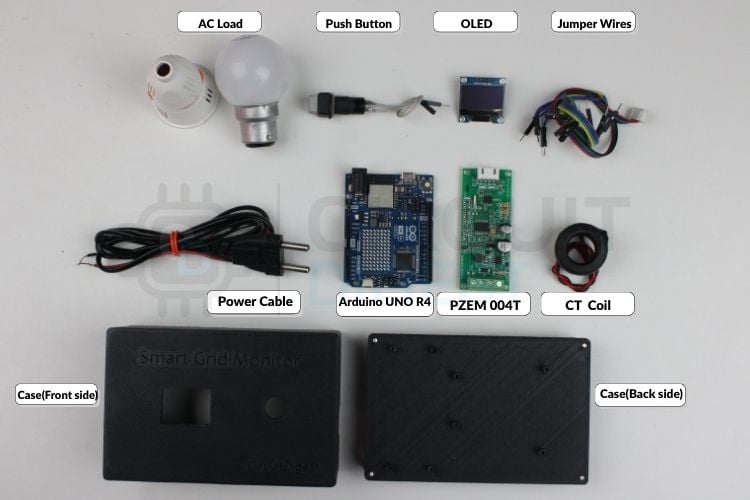
The table shows the list of components and their uses in the circuit.
| Component | Quantity | Notes |
| Arduino UNO R4 WiFi | 1 | Main controller with built-in WiFi and hardware serial for Modbus communication |
| PZEM 004T Energy Meter | 1 | Measures voltage, current, power, energy, frequency, and power factor |
| Current Transformer Coil | 1 | Comes with PZEM, senses load current safely without direct contact |
| OLED Display | 1 | Local display for real-time readings and system status |
| Push Button | 1 | Used to switch display modes or enable rolling screen |
| Breadboard or PCB | 1 | For assembling and testing connections |
| Jumper Wires | Several | Male-to-male and male-to-female wires for signal and power routing |
| USB Cable | 1 | Programming and powering the Arduino board |
| AC Load | 1 | Test load for verifying measurements |
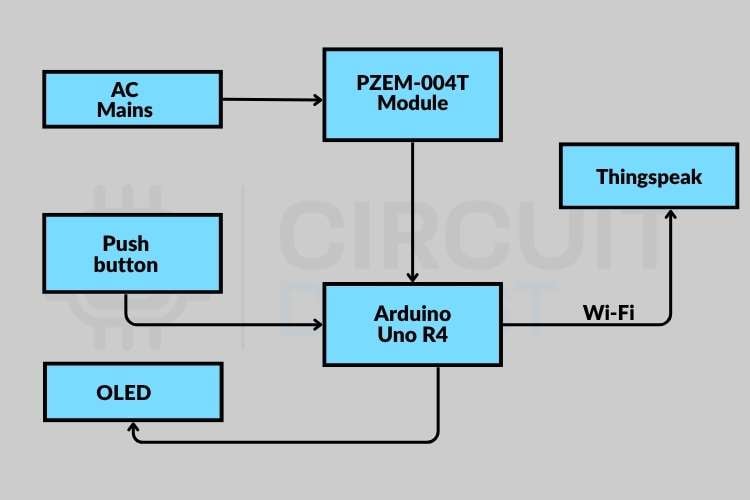
System Architecture of the Smart Grid IoT System
Referring to the smart grid in IoT diagram below, the system follows a three-tier edge-to-cloud architecture. Understanding each tier makes troubleshooting and future expansion straightforward. The system follows a simple edge-to-cloud architecture built around three main blocks. Electrical parameters are first captured by the PZEM 004T, which directly senses mains voltage and uses a current transformer to measure load current safely. The module processes these signals internally and calculates usable values such as voltage, current, power, energy, frequency, and power factor. These measurements are transmitted digitally over Modbus RTU through UART to the Arduino UNO R4 WiFi. The controller acts as the brain of the system. It periodically polls the meter, stores the latest readings, formats the data, and manages timing without blocking the processor, so sensing, display updates, and communication run smoothly together.
After processing, the data flows to two outputs. An OLED display provides immediate local feedback, allowing readings to be checked directly on the device without a laptop. At the same time, the built-in Wi-Fi periodically uploads measurements to ThingSpeak for remote logging and visualization. This creates both real-time monitoring and long-term historical tracking. In short, the PZEM handles measurement, the Arduino handles logic and communication, and the cloud handles storage and analysis. The result is a compact, reliable monitoring node that behaves like a small smart grid endpoint rather than just a standalone meter. This IoT-based smart grid system using Arduino follows a three-tier edge-to-cloud architecture.
| Tier | Component | Role |
| Sensing (Edge) | PZEM-004T + CT Clamp | Measures AC voltage, current, power, energy, frequency, and power factor from the mains line |
| Processing (Gateway) | Arduino UNO R4 WiFi | Polls PZEM via Modbus RTU, formats data, updates OLED display, manages WiFi uploads |
| Storage & Visualisation (Cloud) | ThingSpeak | Receives readings via Write API, stores data and generates automatic time-series graphs |
Circuit Diagram of Smart Grid in IoT
The image below shows the complete smart grid in IoT circuit diagram, including all wiring between the Arduino UNO R4 WiFi, PZEM-004T energy meter, OLED display, and push button.

Wiring Connection Summary
| Signal | PZEM-004T Pin | Arduino UNO R4 WiFi Pin |
| Modbus TX (Serial data out) | TX | Serial1 RX — Pin 0 |
| Modbus RX (Serial data in) | RX | Serial1 TX — Pin 1 |
| Logic Power | 5V | 5V |
| Common Ground | GND | GND |
| OLED I2C Data | — | A4 (SDA) |
| OLED I2C Clock | — | A5 (SCL) |
| Push Button | — | Digital Pin 7 (INPUT_PULLUP) |
Working Principle of the Smart Grid Monitoring System
When the system powers on, the Arduino UNO R4 WiFi initializes the serial ports, OLED display, WiFi interface, and the PZEM 004T. The PZEM continuously senses the AC line. It measures voltage directly from the mains terminals and current through the attached current transformer. Inside the module, these signals are sampled and processed to calculate RMS voltage, RMS current, real power, accumulated energy, frequency, and power factor. Instead of sending raw analog signals, the module stores these values digitally and waits for a Modbus request from the Arduino. This continuous sensing-processing-displaying-uploading loop forms the complete operational cycle of the smart grid IoT monitoring node.
At regular time intervals, the Arduino sends a Modbus query through UART and receives the latest measurements. The firmware checks the response, extracts each parameter, and updates internal variables. These values are immediately displayed on the OLED for local monitoring and printed to the serial console for debugging. If WiFi is available, the same data is transmitted to ThingSpeak, where it is logged and plotted for remote access. This cycle repeats continuously, creating a real-time loop of sensing, processing, displaying, and uploading, which forms the core operation of the smart grid monitoring system. Want to build more smart energy systems? Don’t miss our Electricity Monitoring Project using ESP12 and Arduino.
Smart Grid in IoT Diagram
The smart grid in IoT diagram below illustrates the complete data flow. The PZEM module measures electrical parameters and sends them via UART (Modbus) to the Arduino Uno R4, which processes the data, displays it on OLED, and uploads it to ThingSpeak using built-in WiFi, while also accepting user input through a push button. The system enables real-time monitoring of voltage, current, power, and energy consumption both locally and remotely. The cloud platform stores the data and provides graphical visualization for analysis and tracking over time.
Arduino Library Integration - PZEM004Tv40_R4
The system communicates with the PZEM 004T using a dedicated Arduino library. This library removes the need to manually create Modbus RTU frames, calculate CRC checks, or parse registers. The firmware simply requests the required values, and the library builds the packets, sends them, verifies the response, and extracts the data automatically, which eliminates a common source of bugs in DIY smart grid IoT implementations. This keeps the code clean, easy to read, and reduces common communication errors that occur with manual Modbus implementation.
In the code, integration stays simple and direct. The program creates the PZEM object using the hardware serial port, initializes the module once in the setup function, and reads all parameters with a single function call. It then retrieves voltage, current, power, energy, frequency, and power factor using clear getter functions. This design lets the firmware focus on tasks such as updating the display and uploading data to the cloud, rather than handling low-level communication details.
Setting up ThingSpeak Cloud Account
» Create a free ThingSpeak account using your email and log in to the dashboard.
» After logging in, click New Channel. A channel serves as a container for storing and plotting all your energy readings.
» Inside the channel settings, enable multiple fields and name them clearly, such as Voltage, Current, Power, Energy, Frequency, and Power Factor.
» Proper naming keeps the dashboard readable and avoids confusion later.
» Next, open the API Keys tab. Copy the Channel ID and Write API Key. These two values allow your Arduino to send data securely to the cloud.
» Paste these values into your code. After uploading the firmware, the board will automatically start pushing readings, and graphs will appear on the dashboard in real time. This completes the cloud integration and enables remote monitoring from any device.
Source Code Explanation
The following section explains the parts of the firmware. The explanation focuses on the main data flow, starting from the energy meter, moving through the controller, and finally reaching the display and cloud platform. Secondary setup details and small helper routines are intentionally omitted so the overall logic remains clear, concise, and easy to follow.
Object Initialisation
PZEM004Tv40_R4 pzem(&Serial1);
WiFiClient client;
The PZEM object connects to the hardware Serial1 port to handle Modbus communication with the energy meter, which keeps sensor data traffic separate from the USB debug serial and prevents conflicts, while the WiFi client manages all network communication required to upload readings to the cloud.
Non-Blocking Timer
unsigned long lastReadTime = 0;
const unsigned long readInterval = 1000;
These variables implement non-blocking timing using millis, allowing the program to check elapsed time instead of relying on delay, which keeps the system responsive and enables sensor reading, display updates, and WiFi communication to run smoothly at the same time.
Periodic Sensor Read Trigger
if (currentMillis - lastReadTime >= readInterval) {
 lastReadTime = currentMillis;
 readPZEMData();
}
This block schedules periodic sensor reads by checking the time interval, triggering once every second without pausing the main loop, which maintains consistent sampling while allowing other tasks to continue running in parallel.
Reading All Six Parameters
if (pzem.readAll()) {
 voltage = pzem.getVoltage();
 current = pzem.getCurrent() * 1000;
}
The library reads all measurements in a single Modbus transaction, stores the values in simple variables for later use, and performs unit conversion immediately so the rest of the code works with clear and human-readable numbers.
Display Update and Cloud Upload
updateDisplay();
uploadToThingSpeak();
One function manages local visualization while the other manages cloud logging, which keeps responsibilities clearly separated, avoids mixing display logic with networking tasks, and simplifies debugging because each block can be tested independently.
ThingSpeak Field Assignment and Upload
ThingSpeak.setField(1, voltage);
ThingSpeak.writeFields(myChannelNumber, myWriteAPIKey);
Measured values are first assigned to their respective cloud fields, then a single API call sends all parameters together to ThingSpeak, where the platform automatically stores the data and generates graphs for visualization.
Practical Deployment
Hardware Setup
The hardware was assembled by connecting the Arduino UNO R4 WiFi, the PZEM 004T, the current transformer, and the OLED display into one compact unit. The PZEM measures voltage and current directly from the mains line and sends the readings to the Arduino through UART.
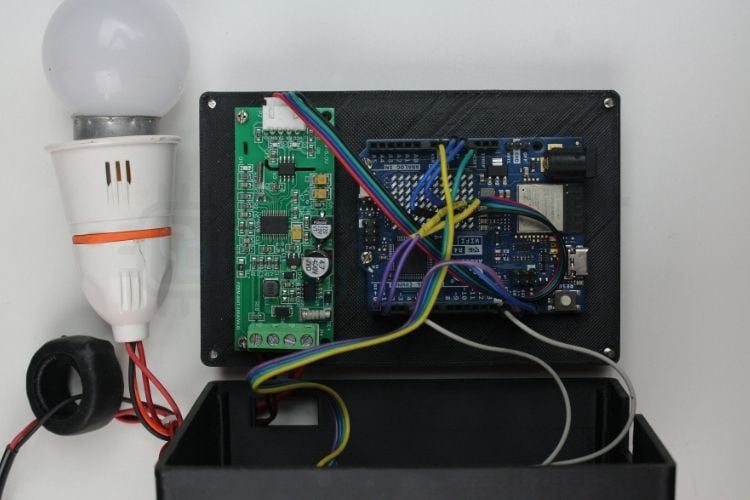
The Arduino processes this data and shows the live values on the OLED screen. This makes it easy to check voltage, current, power, and energy instantly without needing a computer or internet connection.
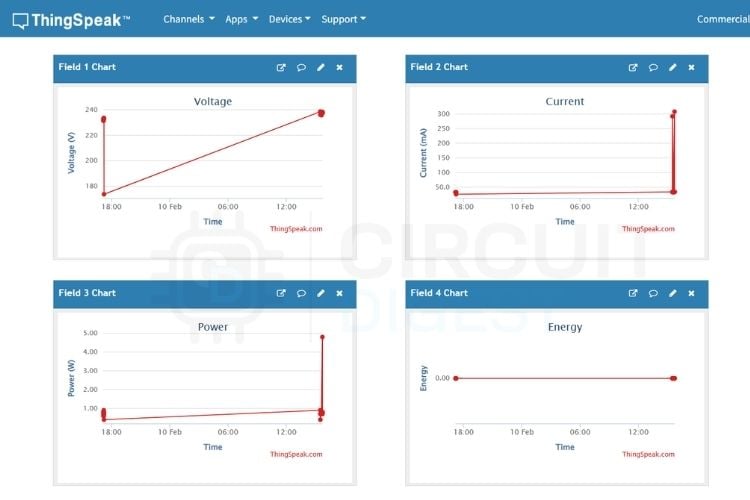
Cloud Dashboard Output
The system sends the same readings to ThingSpeak at regular intervals through WiFi. The platform stores the data and automatically plots graphs for each parameter. These charts help track energy usage over time and make it easy to spot changes or abnormal behavior. This confirms that the IoT-based smart grid system using Arduino project works both as a simple local meter and as a remote monitoring solution.
3D Printed Enclosure
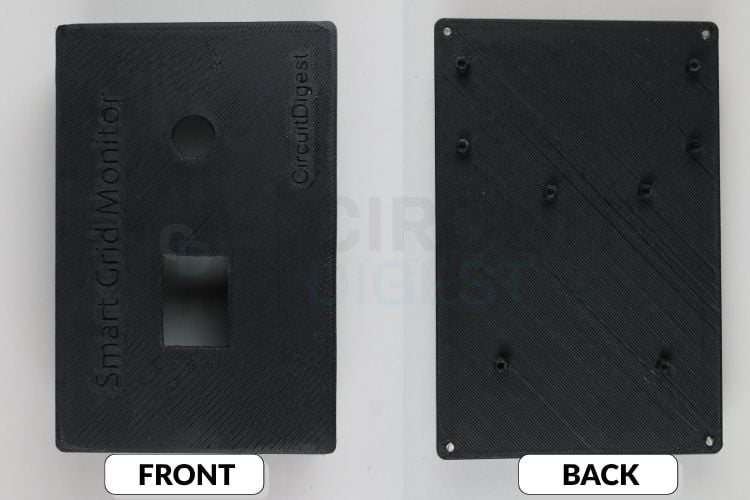
Designed and 3D printed a custom enclosure to safely house all the electronics. Mounted the Arduino UNO R4 WiFi, the PZEM 004T, and the wiring securely inside the cabinet, and added proper cutouts for the OLED display, button, and cables. This keeps the setup neat, protects the components, and gives the project a clean and professional finish suitable for practical use. We also did an interesting project related to an energy meter. When the condition is met, such as voltage exceeded, high current, etc., the system will trigger the sms alert to the user, so spare some time and take a look at our IOT Based Smart Energy Meter with SMS Alert.
Smart Grid IoT Applications
To understand more about this project and where the smart grid Internet of Things (IoT) is being used today, we can use a broader view of the IoT ecosystem. This tutorial will show how the model being developed consists of single-node systems; however, the same design model and firmware used can be scaled up to many instances of deployment in the real world:
∗ Home Energy Management System (HEMS): enable homeowners to monitor energy usage by each appliance, detect standby power, and automate the scheduling of usage to reduce peak demand charges to the homeowner.
∗ Industrial Load Monitoring. enable manufacturers to monitor the energy consumption of production equipment for indications of potential failure due to conditions such as overcurrent, power factor degradation, and unexpected power spikes.
∗ Solar and other renewable systems. The resources output can be monitored and compared to the grid's energy consumption in real-time to determine how to best charge/discharge batteries and decide when to export excess generation to the grid.
∗ Smart Metering for Utilities: This can perform automated data collection of electricity meter readings to replace the need for utilities to perform manual meter readings and reconcile billings.
∗ Electrical Vehicle (EV) Charging Stations Monitoring: Provide validated and complete data on EV charging that can be used for accurate billing to users and evaluation of grid impact.
∗ Laboratory and Workshop Safety: Monitoring load conditions for overloads on Test Disturbance Test Benches will help prevent damage to sensitive equipment and help prevent upstream circuit breakers from tripping.
∗ Agricultural Pumping Systems: can monitor the energy consumption of motors and detect dry-run conditions via an associated current drop, which can help to prevent premature failure of a motor.
∗ Data Centre Power Management: By monitoring electrical power at the rack level of a data centre, it is possible to calculate power usage effectiveness.
Troubleshooting the Smart Grid IoT System
| Issue or Error | Error Code or Symptom | Meaning | Action to Fix |
| No readings from the meter | No response | Arduino not receiving Modbus data | Check TX and RX wiring, verify Serial1 connection, and confirm common ground |
| Communication failure or No data from AC Load | Error code 1 | CRC mismatch or corrupted frame | Reduce wire length, tighten connections, and avoid electrical noise near mains wiring |
| Constant zero current | 0 A shown | CT clamp installed incorrectly | Clamp only one live wire, not both live and neutral |
| OLED not displaying | Blank screen | I2C communication issue | Verify SDA and SCL connections, check I2C address 0x3C |
| Random resets | Board restarts | Unstable power supply | Use a stable 5V adapter, and avoid powering heavy loads from USB |
Future Enhancements for Smart Grid IoT Applications
The current system covers basic real-time monitoring and cloud logging. The design can be expanded further based on application needs. Focus should remain on reliability and useful features rather than adding unnecessary complexity. The modular design makes it straightforward to extend for more advanced smart grid IoT applications:
- Add SD card logging for offline data storage
- Monitor multiple circuits using additional PZEM modules
- Create a web dashboard for local network access
- Add alerts for overcurrent or overvoltage conditions
- Integrate mobile notifications for abnormal readings
- Perform basic analytics such as daily energy reports
GitHub Repository
The complete source code, wiring details, and project files are available in the GitHub repository for reference and reuse.


Conclusion
This project demonstrates how to build a fully functional IoT-based smart grid system using Arduino with practical, cost-effective components. Built a practical smart grid monitoring node using the Arduino UNO R4 WiFi and the PZEM 004T to measure and track electrical parameters in real time. Displayed the readings locally on an OLED and uploaded the same data to ThingSpeak for remote logging and visualization. The overall design stays simple, modular, and easy to maintain, which makes it suitable for learning, testing, and small-scale monitoring applications. Engineers who plan to build similar systems or explore related ideas can continue experimenting with more PZEM-based projects and Arduino-based projects to extend this foundation and apply the same concepts to different monitoring and IoT use cases. To control devices remotely? Don’t miss our Mobile-Operated Home Automation System with Energy Meter using NodeMCU.
Each IoT project was built and tested hands-on by the Circuit Digest engineering team. Our engineers and technical writers focus on creating practical, step-by-step tutorials to help makers, students, and professionals learn.
Frequently Asked Questions
⇥ What is the way that PZEM-004T is measuring current, voltage and power factor?
PZEM-004T samples voltage from an internal resistive divider, while a split-core current transformer, which is compatible with AC, provides a current measurement. The energy metering integrated circuit, which is part of the PZEM-004T piece of hardware employs true RMS techniques to compute RMS voltage and RMS current and uses these values to calculate real power (in watts), (from which the PZEM-004T computes cumulative energy in kWh) while also determining frequency (in Hz) and power factor, each of which can be read digitally via Modbus RTU (9600 baud) over a microcontroller.
⇥ How can I hook up the PZEM-004T to an Arduino UNO R4 WiFi?
Connect the PZEM-004Ts TX PIN to the Serial1 RX of the Arduino UNO R4 WiFi, and vice versa for the RX PIN (cross-connected). Both the PZEM-004T and Arduino UNO R4 WiFi ground reference must be connected together; additionally, the two sets (mains) of terminals for the PZEM-004T must be connected to the AC power source supplying the load to be monitored. Put the CT coil around the hot wire only (not to both hot and neutral); finally, for local display, connect the OLED display SDA and SCL to A4 and A5, respectively.
⇥ What is the power factor, and why do we need to monitor it in a smart grid?
The power factor is a ratio of real power (measured in watts) to apparent power (measured in volt-amperes). If the power factor is less than 0.9, it means that there are a lot of wasted reactive power losses, wasted capacity of the electric grid, and larger distribution system line losses from the electric utility to customers’ locations, including homes and businesses. The electric utilities will charge additional surcharges for keeping an overall low power factor for a long period of time in industrial settings, such as factories and other commercial-type clients. By monitoring power factor in a smart grid IoT system, utilities can identify inefficient inductive loads such as motors, transformers, and fluorescent lighting ballasts, with the aim of correcting them prior to incurring any penalty charges.
⇥ Is this IoT smart energy grid project capable of being expanded to accommodate industrial use or three-phase applications?
Yes. You could connect multiple PZEM004T’s on their own Modbus Address (addressed via UART commands) together to monitor different circuits or machines with one Arduino (microcontroller). For three-phase applications, one PZEM-004T for each phase will provide a complete three-phase analysis of power. An SD card module can also be employed for local offline logging; in addition, you could use either a Raspberry Pi or an industrial PC to host the local SCADA-like dashboard; however, this may require minimal firmware modification to the core architecture.
⇥ How do I upload measurement data to ThingSpeak in the project?
This project uploads measurement data to ThingSpeak by connecting a Wi-Fi-enabled Arduino to an Access Point via Wi-Fi and using the ThingSpeak Arduino library to send an HTTP POST message containing six measurements (grouped into six channels) every 15 seconds. The measurements are assigned to ThingSpeak channels using ThingSpeak.set_field() statements and sent all six measurements in a single ThingSpeak.write_fields() call. Each measurement entry is timestamped by the ThingSpeak server at the time the server receives the data and does not require any additional configuration to update all six channel graphs in real-time.
⇥ What are the important safety precautions when constructing a smart grid IoT-based project?
Always disconnect the mains supply before making any changes or connections to the mains wiring on the PZEM-004T mains terminals. Use wire terminals and connectors that are rated and suited to the maximum value of the voltage and current to be carried by the terminals and connectors when connecting and disconnecting the wires used at the PZEM-004T terminals. Only attach the current transducer to the live wire and never to both the live(supply) wire and neutral(wire), as doing so will cancel out the magnetic flux generated by the current flow and cause the current reading to read zero. All mains-connected devices should be enclosed in a fully sealed enclosure made of a non-conductive material, and care should always be taken when testing live AC circuit terminals with exposed test probes.
Similar Energy Monitoring Projects
Explore hands-on projects that tackle energy metering, real-time power monitoring, and precision current sensing using Arduino, ESP32, and STM32.

Prepaid Energy Meter using GSM and Arduino
Arduino-based prepaid energy meter using GSM to recharge via SMS, send low balance alerts, and automatically control power supply.

DIY Power Consumption Monitoring Device using ESP32
ESP32-based real-time energy monitoring system that measures voltage, current, and power, and displays data online for smart energy tracking.

Build a Precision Digital Micro Current Meter with STM32
STM32-based precision micro current meter that measures nanoamp to milliamp currents with high accuracy and displays real-time data on an OLED.
Complete Project Code
#include <WiFiS3.h>
#include <Wire.h>
#include <Adafruit_GFX.h>
#include <Adafruit_SSD1306.h>
#include <ThingSpeak.h>
#include <PZEM004Tv40_R4.h>

// WiFi credentials
const char* ssid = "Semicon Media";
const char* password = "cracksen1605";

// ThingSpeak settings
unsigned long myChannelNumber = 3238257;
const char* myWriteAPIKey = "CRXGU545EOA6Z8R9";

// OLED Display settings
#define SCREEN_WIDTH 128
#define SCREEN_HEIGHT 64
#define OLED_RESET -1
#define SCREEN_ADDRESS 0x3C

// Button settings
#define BUTTON_PIN 4

Adafruit_SSD1306 display(SCREEN_WIDTH, SCREEN_HEIGHT, &Wire, OLED_RESET);
PZEM004Tv40_R4 pzem(&Serial1);
WiFiClient client;

// Timing variables (non-blocking)
unsigned long lastReadTime = 0;
unsigned long lastUploadTime = 0;
unsigned long lastSerialPrintTime = 0;
unsigned long lastDisplayUpdateTime = 0;
unsigned long lastDisplaySwitchTime = 0;
unsigned long wifiConnectStartTime = 0;
unsigned long lastButtonPressTime = 0;

const unsigned long readInterval = 1000;
const unsigned long serialPrintInterval = 1000;
const unsigned long displayUpdateInterval = 500;
const unsigned long displaySwitchInterval = 5000;
const unsigned long uploadInterval = 16000;
const unsigned long wifiTimeout = 10000;
const unsigned long debounceDelay = 200;

// Display mode (0 = all parameters, 1-6 = individual parameters)
int displayMode = 0;

// Rolling display control
bool rollingEnabled = false;
bool lastButtonState = HIGH;
bool buttonState = HIGH;

// State machine for WiFi
enum WiFiState {
 WIFI_IDLE,
 WIFI_CONNECTING,
 WIFI_CONNECTED,
 WIFI_FAILED
};

WiFiState wifiState = WIFI_IDLE;

// Data storage
float voltage = 0.0;
float current = 0.0;
float power = 0.0;
float energy = 0.0;
float frequency = 0.0;
float powerFactor = 0.0;
bool dataValid = false;

void setup() {
 Serial.begin(115200);

 Serial.println("PZEM-004T Energy Monitor with ThingSpeak");
 Serial.println("==========================================");

 // Initialize OLED
 if (!display.begin(SSD1306_SWITCHCAPVCC, SCREEN_ADDRESS)) {
   Serial.println(F("SSD1306 allocation failed"));
   while (1);
 }

 display.clearDisplay();
 display.setTextColor(SSD1306_WHITE);
 display.setTextSize(1);
 display.setCursor(0, 0);
 display.println("PZEM Monitor");
 display.println("Initializing...");
 display.display();

 // Initialize button pin with internal pullup
 pinMode(BUTTON_PIN, INPUT_PULLUP);

 // Initialize PZEM
 pzem.begin();

 // Initialize ThingSpeak
 ThingSpeak.begin(client);

 // Start WiFi connection
 wifiState = WIFI_CONNECTING;
 WiFi.begin(ssid, password);
 wifiConnectStartTime = millis();

 Serial.print("Connecting to WiFi: ");
 Serial.println(ssid);
}

void loop() {
 unsigned long currentMillis = millis();

 // Handle button press
 handleButton(currentMillis);

 // Handle WiFi state machine
 handleWiFi(currentMillis);

 // Read PZEM data (non-blocking interval)
 if (currentMillis - lastReadTime >= readInterval) {
   lastReadTime = currentMillis;
   readPZEMData();
 }

 // Update Serial Monitor (non-blocking interval)
 if (currentMillis - lastSerialPrintTime >= serialPrintInterval && dataValid) {
   lastSerialPrintTime = currentMillis;
   printToSerial();
 }

 // Switch display mode every 5 seconds (only if rolling is enabled)
 if (rollingEnabled && (currentMillis - lastDisplaySwitchTime >= displaySwitchInterval)) {
   lastDisplaySwitchTime = currentMillis;
   displayMode++;
   if (displayMode > 6) {
     displayMode = 1;  // Reset to first individual parameter (Voltage), skip all-in-one
   }
 }

 // Update OLED Display (non-blocking interval)
 if (currentMillis - lastDisplayUpdateTime >= displayUpdateInterval) {
   lastDisplayUpdateTime = currentMillis;
   updateDisplay();
 }

 // Upload to ThingSpeak (non-blocking interval)
 if (currentMillis - lastUploadTime >= uploadInterval && dataValid) {
   if (wifiState == WIFI_CONNECTED) {
     lastUploadTime = currentMillis;
     uploadToThingSpeak();
   }
 }
}

void handleWiFi(unsigned long currentMillis) {
 switch (wifiState) {
   case WIFI_IDLE:
     break;

   case WIFI_CONNECTING:
     if (WiFi.status() == WL_CONNECTED) {
       wifiState = WIFI_CONNECTED;
       Serial.println("\nWiFi Connected!");
       Serial.print("IP Address: ");
       Serial.println(WiFi.localIP());

       display.clearDisplay();
       display.setCursor(0, 0);
       display.println("WiFi Connected!");
       display.print("IP: ");
       display.println(WiFi.localIP());
       display.display();
     } else if (currentMillis - wifiConnectStartTime >= wifiTimeout) {
       wifiState = WIFI_FAILED;
       Serial.println("\nWiFi Connection Failed!");

       display.clearDisplay();
       display.setCursor(0, 0);
       display.println("WiFi Failed!");
       display.println("Running offline");
       display.display();
     }
     break;

   case WIFI_CONNECTED:
     if (WiFi.status() != WL_CONNECTED) {
       Serial.println("WiFi Disconnected! Reconnecting...");
       wifiState = WIFI_CONNECTING;
       WiFi.begin(ssid, password);
       wifiConnectStartTime = currentMillis;
     }
     break;

   case WIFI_FAILED:
     if (currentMillis - wifiConnectStartTime >= 30000) {
       Serial.println("Retrying WiFi connection...");
       wifiState = WIFI_CONNECTING;
       WiFi.begin(ssid, password);
       wifiConnectStartTime = currentMillis;
     }
     break;
 }
}

void handleButton(unsigned long currentMillis) {
 // Read the button state
 int reading = digitalRead(BUTTON_PIN);

 // Check if button state has changed and debounce
 if (reading != lastButtonState) {
   lastButtonPressTime = currentMillis;
 }

 if ((currentMillis - lastButtonPressTime) > debounceDelay) {
   // If the button state has changed
   if (reading != buttonState) {
     buttonState = reading;

     // Button pressed (LOW because of pullup)
     if (buttonState == LOW) {
       // Toggle rolling mode
       rollingEnabled = !rollingEnabled;

       if (rollingEnabled) {
         Serial.println("Rolling display ON");
         displayMode = 1;  // Start from first individual parameter (Voltage)
         lastDisplaySwitchTime = currentMillis;  // Reset timer
       } else {
         Serial.println("Rolling display OFF");
         displayMode = 0;  // Go to all-in-one display immediately
       }
     }
   }
 }

 lastButtonState = reading;
}

void readPZEMData() {
 if (pzem.readAll()) {
   voltage = pzem.getVoltage();
   current = pzem.getCurrent() * 1000;
   power = pzem.getPower();
   energy = pzem.getEnergy();
   frequency = pzem.getFrequency();
   powerFactor = pzem.getPowerFactor();
   dataValid = true;
 } else {
   dataValid = false;
   Serial.print("Error reading PZEM! Code: ");
   Serial.println(pzem.getLastError());
 }
}

void printToSerial() {
 Serial.print("Voltage:      ");
 Serial.print(voltage, 1);
 Serial.println(" V");

 Serial.print("Current:      ");
 Serial.print(current, 0);
 Serial.println(" mA");

 Serial.print("Power:        ");
 Serial.print(power, 1);
 Serial.println(" W");

 Serial.print("Energy:       ");
 Serial.print(energy, 3);
 Serial.println(" kWh");

 Serial.print("Frequency:    ");
 Serial.print(frequency, 1);
 Serial.println(" Hz");

 Serial.print("Power Factor: ");
 Serial.println(powerFactor, 2);
 Serial.println("------------------------");
}

void updateDisplay() {
 display.clearDisplay();

 if (!dataValid) {
   display.setTextSize(1);
   display.setCursor(0, 0);
   display.println("ERROR!");
   display.println("");
   display.print("Code: ");
   display.println(pzem.getLastError());
   display.println("");
   display.println("Check connections");
   display.display();
   return;
 }

 // Display based on current mode
 switch (displayMode) {
   case 0:
     displayAllParameters();
     break;
   case 1:
     displaySingleParameter("Voltage", voltage, 1, "V");
     break;
   case 2:
     displaySingleParameter("Current", current, 0, "mA");
     break;
   case 3:
     displaySingleParameter("Power", power, 1, "W");
     break;
   case 4:
     displaySingleParameter("Energy", energy, 3, "kWh");
     break;
   case 5:
     displaySingleParameter("Frequency", frequency, 1, "Hz");
     break;
   case 6:
     displaySingleParameter("Power Factor", powerFactor, 2, "");
     break;
 }

 display.display();
}
void displayAllParameters() {
 display.setTextSize(1);

 // Title
 display.setCursor(0, 0);
 display.println("Energy Monitor");
 display.drawLine(0, 10, 127, 10, SSD1306_WHITE);

 // Voltage
 display.setCursor(0, 14);
 display.print("Voltage : ");
 display.print(voltage, 1);
 display.println(" V");

 // Current (in mA)
 display.setCursor(0, 24);
 display.print("Current : ");
 display.print(current, 0);
 display.println(" mA");

 // Power
 display.setCursor(0, 34);
 display.print("Power   : ");
 display.print(power, 1);
 display.println(" W");

 // Energy
 display.setCursor(0, 44);
 display.print("Energy  : ");
 display.print(energy, 3);
 display.println(" kWh");

 // Frequency and Power Factor
 display.setCursor(0, 54);
 display.print("Freq:");
 display.print(frequency, 1);
 display.print("Hz");

 display.setCursor(75, 54);
 display.print("PF:");
 display.print(powerFactor, 2);

 //WiFi status indicator
 if (wifiState == WIFI_CONNECTED) {
   display.fillRect(118, 6, 2, 2, SSD1306_WHITE);
   display.fillRect(121, 4, 2, 4, SSD1306_WHITE);
   display.fillRect(124, 2, 2, 6, SSD1306_WHITE);
 }
}

void displaySingleParameter(const char* paramName, float value, int decimals, const char* unit) {
 // Display parameter name at top
 display.setTextSize(1);
 display.setCursor(0, 0);
 display.println(paramName);
 display.drawLine(0, 10, 127, 10, SSD1306_WHITE);

 // Display value in large font (size 2)
 display.setTextSize(2);

 // Convert value to string with proper decimal places
 char valueStr[16];
 dtostrf(value, 0, decimals, valueStr);

 // Calculate position to center the value and unit
 int16_t x1, y1;
 uint16_t w, h;
 display.getTextBounds(valueStr, 0, 0, &x1, &y1, &w, &h);

 // Position value in the middle of screen
 int valueX = (SCREEN_WIDTH - w) / 2;
 int valueY = 28;

 display.setCursor(valueX, valueY);
 display.print(valueStr);

 // Display unit in smaller font next to value
 if (strlen(unit) > 0) {
   display.setTextSize(1);
   // Position unit right after the value
   display.setCursor(valueX + w + 4, valueY + 8);
   display.print(unit);
 }

 // WiFi status indicator
 if (wifiState == WIFI_CONNECTED) {
   display.fillRect(118, 6, 2, 2, SSD1306_WHITE);
   display.fillRect(121, 4, 2, 4, SSD1306_WHITE);
   display.fillRect(124, 2, 2, 6, SSD1306_WHITE);
 }
}

void uploadToThingSpeak() {
 Serial.println("\nUploading to ThingSpeak...");

 // Set the fields
 ThingSpeak.setField(1, voltage);
 ThingSpeak.setField(2, current);
 ThingSpeak.setField(3, power);
 ThingSpeak.setField(4, energy);
 ThingSpeak.setField(5, frequency);
 ThingSpeak.setField(6, powerFactor);

 // Write to ThingSpeak channel
 int statusCode = ThingSpeak.writeFields(myChannelNumber, myWriteAPIKey);

 if (statusCode == 200) {
   Serial.println("Channel update successful!");
   Serial.print("  Voltage: ");
   Serial.print(voltage, 1);
   Serial.println(" V");
   Serial.print("  Current: ");
   Serial.print(current, 0);
   Serial.println(" mA");
   Serial.print("  Power: ");
   Serial.print(power, 1);
   Serial.println(" W");
   Serial.print("  Energy: ");
   Serial.print(energy, 3);
   Serial.println(" kWh");
   Serial.print("  Frequency: ");
   Serial.print(frequency, 1);
   Serial.println(" Hz");
   Serial.print("  Power Factor: ");
   Serial.println(powerFactor, 2);
 } else {
   Serial.print("Problem updating channel. HTTP error code: ");
   Serial.println(statusCode);
 }

 Serial.println();
}