Impact Statement
This project implements AI based cardiovascular disease prediction from the ECG waveform along with vital parameters like SpO2 and pulse rate. Arduino UNO R4 WIFI is the central microcontroller which interfaces with MAX30102 sensor, ECG module and OLED display. The MAX30102 is connected to the wristband for continuous monitoring and the electrodes are attached to the left chest, right chest and right abdomen. In the MATLAB platform, the ECG signal collected from the microcontroller is processed and features are extracted for the disease prediction. The AI model is trained in the MATLAB platform using a classification learner and then compared with the extracted data. The predicted disease is then displayed on the OLED display.
Navigate to this YouTube Video for full Demonstration of the Project
Circuit Diagram Explanation
In the circuit diagram, the Arduino UNO R4 WIFI serves as the central microcontroller, coordinating the input and output of the sensors. The MAX30102 sensor reads the pulse rate and SpO2 levels. It communicates with the Arduino via I2C protocol, using the SDA and SCL pins. The ECG module with three electrodes is connected to the left chest, right chest and right abdomen of the body and feeds the heart's electrical signals into the Arduino. The sensor data is processed and displayed on the OLED screen, which is connected via I2C. All the components are interconnected on a dot board ensuring proper placement, routing and stable connections.
Project Overview

Components Required
AD8232 ECG module - 1
Dot board - 1
Jumping wires - Required Quantity
Connectors - Required Quantity
Berg pins - Required Quantity
Code Explanation
Part 1: Arduino Code Initialization
#include "wire.h"#include "Adafruit_GFX.h"#include "Adafruit_SSD1306.h"#define REG_FIFO_DATA 0x07#define REG_MODE_CONFIG 0x09#define REG_SPO2_CONFIG 0x0A#define REG_LED_RED 0x0C#define REG_LED_IR 0x0D#define REG_PART_ID 0xFF#define SCREEN_WIDTH 128#define SCREEN_HEIGHT 64#define OLED_ADDR 0x3C#define OLED_RESET -1Adafruit_SSD1306 display(SCREEN_WIDTH, SCREEN_HEIGHT, &Wire, OLED_RESET);unsigned long previousMillis = 0;const long interval = 30000;long totalRedValue = 0;long totalIRValue = 0;int count = 0;
This Arduino program interfaces with an OLED display and MAX30102 sensor to monitor the heart rate and blood oxygen levels. Using the libraries Wire.h enables the I2C communication and Adafruit_GFX.h, Adafruit_SSD1306.h controls the OLED display. The program initializes an OLED screen with a 128x64 resolution. Key register addresses for the pulse oximeter are defined to configure modes and retrieve RED and IR LED data. The program takes readings every 30 seconds, accumulating RED and IR values in totalRedValue and totalIRValue, with a counter to track the number of samples. The display is updated regularly to show the vitals.
MAX30102 Setup
void max30102_setup() {delay(500);write_max30102_register(REG_MODE_CONFIG, 0x40);delay(100);write_max30102_register(REG_MODE_CONFIG, 0x03); write_max30102_register(REG_SPO2_CONFIG, 0x27); write_max30102_register(REG_LED_RED, 0xFF); write_max30102_register(REG_LED_IR, 0xFF);Serial.println("MAX30102 initialized"); }long read_max30102_data() {Wire.beginTransmission(0x57);Wire.write(REG_FIFO_DATA);Wire.endTransmission(false);Wire.requestFrom(0x57, 6);long redValue = ((long)Wire.read() << 16) | ((long)Wire.read() << 8) | (long)Wire.read(); long irValue = ((long)Wire.read() << 16) | ((long)Wire.read() << 8) | (long)Wire.read(); return redValue;}void write_max30102_register(byte reg, byte value) {Wire.beginTransmission(0x57);Wire.write(reg); Wire.write(value);Wire.endTransmission();}byte read_max30102_register(byte reg) {Wire.beginTransmission(0x57);Wire.write(reg);Wire.endTransmission(false);Wire.requestFrom(0x57, 1);return Wire.read();}float calculateSpO2(long redValue, long irValue) {if (irValue == 0) {return 0.0;}float SpO2 = 110 - (25 * ((float)redValue / (float)irValue));return SpO2;}
This code configures and reads data from the MAX30102 sensor, used for measuring heart rate and SpO₂ levels. The max30102_setup() function initializes the sensor by setting it to SpO₂ mode, configuring sample rates, and setting LED intensities. read_max30102_data() retrieves red and infrared (IR) light values, which represent blood oxygen levels and heart rate. Helper functions write_max30102_register() and read_max30102_register() handle I2C communication with specific registers. Finally, calculateSpO2() estimates SpO₂ using the ratio of red to IR light absorption. If the IR value is zero, it avoids errors by returning 0. This setup enables real-time SpO₂ monitoring.
Sensor Reading
void loop() {int ecgValue = analogRead(A1);Serial.println(ecgValue);delay(1);long redValue = read_max30102_data();long irValue = read_max30102_data();if (redValue < 50000 || irValue < 50000) { Serial.println("No finger detected or values too low."); } else { totalRedValue += redValue; totalIRValue += irValue; count++; unsigned long currentMillis = millis(); if (currentMillis - previousMillis >= interval) {float averageSpO2 = calculateSpO2(totalRedValue / count, totalIRValue / count); Serial.print("Average SpO2 over 30 seconds: ");Serial.print(averageSpO2);Serial.println(" %");if (Serial.available() > 0) {String receivedData = Serial.readString();int pulseRateStart = receivedData.indexOf("Pulse Rate: ") + 12;int pulseRateEnd = receivedData.indexOf(" BPM");int predictionStart = receivedData.indexOf("Prediction: ") + 12;float pulseRate = receivedData.substring(pulseRateStart, pulseRateEnd).toFloat();String prediction = receivedData.substring(predictionStart);display.clearDisplay();drawHeart();displayHeartRate(averageSpO2, prediction, pulseRate);display.display();totalRedValue = 0;totalIRValue = 0;count = 0;previousMillis = currentMillis; } } }delay(100);}
This Arduino code continuously reads ECG values from an analog pin A1 and captures data from a MAX30102 sensor. If red or infrared values are below 50,000, it indicates no finger is detected. If valid data is received, it aggregates red and infrared values to calculate the average SpO2 every 30 seconds. It also checks for incoming serial data, extracts pulse rate and prediction information, and displays them on the OLED screen along with the average SpO2. After displaying, it resets the total values and the count, and updates the previous time for the next interval. The loop runs with a 30 seconds delay.
OLED Display
void setup() {Serial.begin(9600);if (!display.begin(SSD1306_SWITCHCAPVCC, OLED_ADDR)) { Serial.println(F("SSD1306 allocation failed"));for (;;);}display.clearDisplay();display.setTextSize(1);display.setTextColor(SSD1306_WHITE);display.setCursor(0, 0);display.println("Disease Prediction");display.display();delay(2000);display.clearDisplay();void drawHeart() {display.fillCircle(15, 15, 10, SSD1306_WHITE);display.fillCircle(35, 15, 10, SSD1306_WHITE);display.fillTriangle(5, 15, 45, 15, 25, 30, SSD1306_WHITE);}void displayHeartRate(float spO2, String prediction, float pulseRate) { display.setTextSize(1);display.setTextColor(SSD1306_WHITE);display.setCursor(0, 0);display.print("SpO2: ");display.print(spO2);display.println(" %");display.setCursor(0, 20);display.print("Pulse Rate: ");display.print(pulseRate);display.println(" BPM");display.setCursor(0, 40);display.print("Prediction: ");display.print(prediction);}
This Arduino code initializes an OLED display for disease prediction. The setup() function checks the display connection, shows Disease Prediction. The drawHeart() function creates a heart shape, while displayHeartRate() displays SpO2 percentage, pulse rate, and prediction on the screen.
Part 2: Model Training
function [trainedClassifier, validationAccuracy] = trainClassifier(trainingData)inputTable = trainingData;predictorNames = {'Amplitude', 'RR', 'Speed', 'Age', 'Gender'};predictors = inputTable(:, predictorNames);response = inputTable.Arrhythmia;isCategoricalPredictor = [false, false, false, false, true];classNames = categorical({'Bradycardia'; 'Normal'; 'Tachycardia'; 'ventricular Tachycardia'});classificationTree = fitctree(...predictors, ...response, ...'SplitCriterion', 'gdi', ...'MaxNumSplits', 4, ...'Surrogate', 'off', ...'ClassNames', classNames);predictorExtractionFcn = @(t) t(:, predictorNames);treePredictFcn = @(x) predict(classificationTree, x);trainedClassifier.predictFcn = @(x) treePredictFcn(predictorExtractionFcn(x));trainedClassifier.RequiredVariables = {'Amplitude', 'RR', 'Speed', 'Age', 'Gender'};trainedClassifier.ClassificationTree = classificationTree;inputTable = trainingData;predictorNames = {'Amplitude', 'RR', 'Speed', 'Age', 'Gender'};predictors = inputTable(:, predictorNames);response = inputTable.Arrhythmia;isCategoricalPredictor = [false, false, false, false, true];classNames = categorical({'Bradycardia'; 'Normal'; 'Tachycardia'; 'ventricular Tachycardia'});partitionedModel = crossval(trainedClassifier.ClassificationTree, 'KFold', 5);[validationPredictions, validationScores] = kfoldPredict(partitionedModel);validationAccuracy = 1 - kfoldLoss(partitionedModel, 'LossFun', 'ClassifError');
This MATLAB function trainClassifier trains a classification tree to predict types of disease based on a dataset. It selects features like Amplitude, RR, Speed, Age, and Gender as predictors, with 'Gender' as categorical. It has four classes such as normal, bradycardia, tachycardia and ventricular tachycardia. The function uses the fitctree function to create a decision tree with a maximum of 4 splits. It defines a prediction function for the trained model and prepares it for validation. The classifier is evaluated using 5-fold cross-validation, predicting responses on validation data and calculating accuracy by determining the classification error rate. Overall Accuracy of the model is 99.2%.
Scattered Plot for The Training Data

This scattered plot represents the data points from the train data and plots the relationship between the Amplitude in x axis and RR interval in y axis. The blue data points represents the Bradycardia, orange data points represents the normal, yellow data points represents the Tachycardia and the violet data points represent the Ventricular Tachycardia.
Confusion Matrix

This confusion matrix shows the validation results for model in predicting classes like Bradycardia, Normal, Tachycardia and Ventricular Tachycardia. Rows represent actual classes, columns predicted classes.
Part 3: MATLAB Code Initialization and ECG Data Collection
arduinoObj = serialport("COM11", 9600);configureTerminator(arduinoObj, "CR/LF");numSamples = 1000;ecgData = zeros(1, numSamples);disp('Collecting ECG data...');for i = 1:numSamples data = readline(arduinoObj);numericData = str2double(data);if isnan(numericData) || isinf(numericData)numericData = 0;endecgData(i) = numericData;end
This MATLAB code establishes a serial connection to an Arduino on COM11 at 9600 baud. It prepares to collect 1,000 ECG samples by reading data from the Arduino. Each sample is converted to a numeric value, replacing any non-numeric or infinite readings with zero, and stored in an array.
Signal Processing
samplingRate = 250;ecgDataScaled = (ecgData - min(ecgData)) / (max(ecgData) - min(ecgData));windowSize = 10;ecgDataSmoothed = movmean(ecgDataScaled, windowSize);[b, a] = butter(2, 0.5/(numSamples/2), 'high');if all(isfinite(ecgDataSmoothed))ecgDataFiltered = filtfilt(b, a, ecgDataSmoothed);elseerror('Signal contains non-finite values.');end
This MATLAB code processes ECG data by first normalizing it to a range of 0 to 1 using min-max scaling. The samplingRate is set to 250 Hz, and a moving average with a window size of 10 is applied to smooth the scaled ECG data, reducing noise. A high-pass Butterworth filter is designed with a second-order polynomial and a cutoff frequency of 0.5 Hz, calculated based on the number of samples. The code checks if all smoothed ECG data points are finite. If they are, it applies the filter using filtfilt, which performs zero-phase filtering. Otherwise, it raises an error for non-finite values.
Feature Extraction
minPeakHeight = 0.15;minPeakDistance = 50;[peaks, locs] = findpeaks(ecgDataFiltered, 'MinPeakHeight', minPeakHeight, 'MinPeakDistance', minPeakDistance);scalingFactor = 1;rAmplitudes = peaks * scalingFactor;averageRAmplitude = mean(rAmplitudes);if length(locs) > 1rrIntervals = diff(locs);rrIntervalsSec = rrIntervals / samplingRate;averageRRIntervalSec = mean(rrIntervalsSec); rrIntervalSpeedMs = (averageRAmplitude / averageRRIntervalSec);pulseRate = 60 / averageRRIntervalSec;else rrIntervalSpeedMs = NaN;pulseRate = NaN;end
This MATLAB code detects peaks in filtered ECG data using the findpeaks function with parameters for minimum peak height of 0.15 and minimum peak distance of 50 samples. It calculates the R-wave amplitudes and their average. If multiple peaks are detected, it computes RR intervals in seconds, the average RR interval, and pulse rate; otherwise, it assigns NaN to these values.
Prediction
age = 20;gender = categorical({'M'});features = table( averageRAmplitude,averageRRIntervalSec,rrIntervalSpeedMs, age, gender, 'VariableNames', {'Amplitude', 'RR', 'Speed', 'Age', 'Gender'}); load('ClassificationLearnerSession.mat');[predictions, scores] = trainedModel.predictFcn(features); disp('Predictions:');disp(predictions);disp('Scores:');disp(scores);
This MATLAB code creates a table of features for prediction, including average R-wave amplitude, average RR interval, RR interval speed, age, and gender. It then loads a pre-trained classification model from a file, uses the model to predict outcomes based on the features, and displays the predictions and associated scores.
Serial Communication
predictionText = char(predictions);writeline(arduinoObj, predictionText);pulseRateStr = num2str(pulseRate);writeline(arduinoObj, pulseRateStr);
This MATLAB code converts predictions to text and sends them to the Arduino, along with the pulse rate as a string.
ECG Waveform Plot
figure;subplot(3,1,1);plot(ecgDataScaled);title('Raw ECG Waveform');xlabel('Time (samples)');ylabel('ECG Signal');grid on;subplot(3,1,2);plot(ecgDataSmoothed);title('Smoothed ECG Waveform');xlabel('Time (samples)');ylabel('ECG Signal');grid on;subplot(3,1,3);plot(ecgDataFiltered);hold on;plot(locs, peaks, 'r*', 'MarkerSize', 8);title('Filtered ECG Waveform with Detected R-peaks');xlabel('Time (samples)');ylabel('ECG Signal');grid on;for i = 1:length(locs)line([locs(i) locs(i)], ylim, 'Color', 'r', 'LineStyle', '--', 'LineWidth', 0.5);endfigure;bar(scores);title('Prediction Scores');xlabel('Classes');ylabel('Scores');xticklabels({'Bradycardia', 'Normal', 'Tachycardia', 'Ventricular Tachycardia'});xtickangle(45);
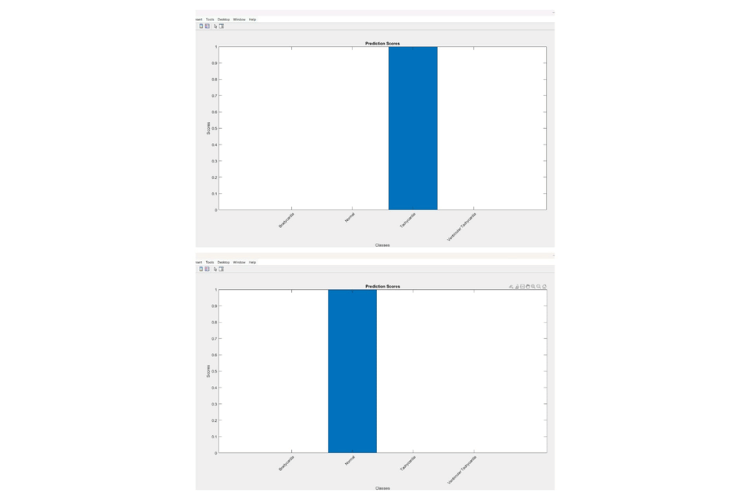
This MATLAB code generates two figures. The first figure displays three subplots: the raw ECG waveform, the smoothed ECG waveform, and the filtered ECG waveform with detected R-peaks marked in red. The second figure is a bar chart showing prediction scores for different disease classes.
3D Design
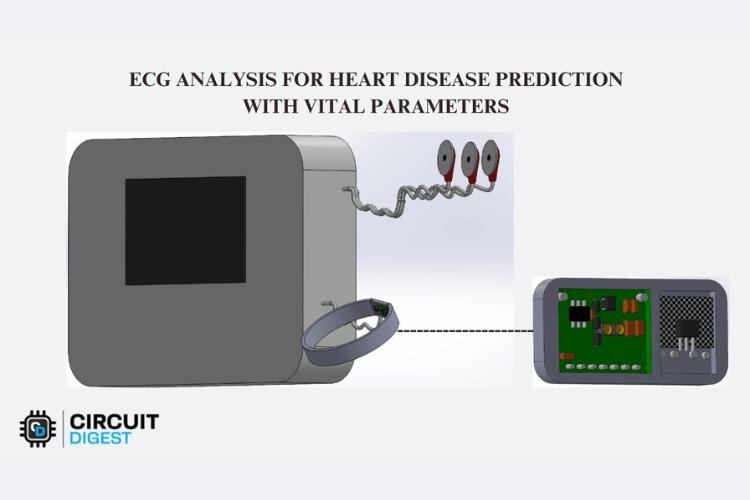
The 3D model is created in SolidWorks platform. It consists of main box with display which is used to display real time results. The dot board is placed inside the box. The ECG electrodes are connected to the box. The wearable structure wristband is attached with the max30102 sensor and it is connected to the box.

Hardware Setup

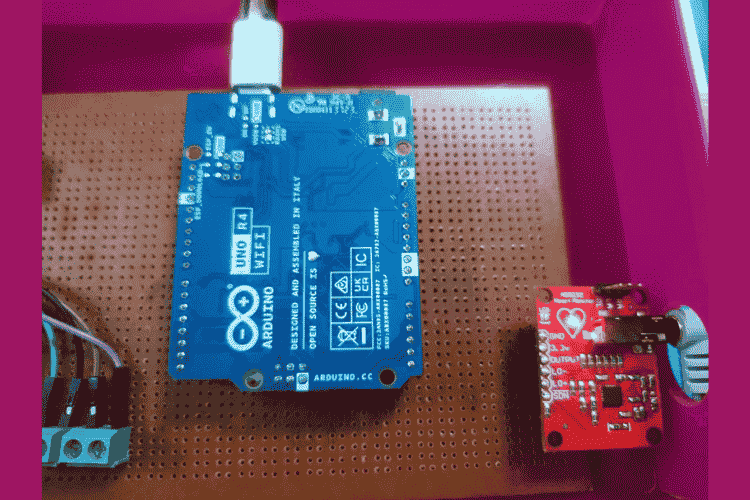
The Arduino UNO R4 WIFI microcontroller is connected with MAX30102 sensor, OLED display and AD8232 ECG module in dot board using connectors. Then the ECG module is connected with the three electrodes.


Result

The first plot displays the original ECG waveform with noise and baseline wander artifacts. The second plot displays the smoothened ECG signal which reduces the noise and artifacts. The third plot displays the filtered ECG signal with the detected R peaks marked by red asterisks and vertical dashed lines. R peaks are identified by locating the highest points in each heartbeat cycle. The SNR ratios are 14.5 dB for the raw ECG waveform, 19.2 dB for the smoothened ECG waveform and 22.5 dB for the filtered ECG waveform.

The OLED displays the result of the four classes. In normal the ECG wave is collected from the user and features are extracted. The extracted features are compared with the trained model and SpO2 value is calculated from the MAX30102 sensor. The heart rate is calculated from the RR interval of each heartbeat cycle. To test the other conditions such as tachycardia, bradycardia and ventricular tachycardia, we have replaced the variables like amplitude, RR interval and speed with the testing data variables.


This is the prediction scores of the four classes Bradycardia, Tachycardia, ventricular tachycardia and normal.
Click on the GitHub Image to view or download code


