
Energy Monitors, whether covering the entire apartment or deployed to monitor just one appliance, provide a way for you to keep track of your consumption and make necessary adjustments. While they are increasingly becoming available on the market, the maker in me still feels it will be a great idea to build a DIY version that could be tailored to meet specific personal requirements. As such, for today’s tutorial, we will build a Raspberry Pi Power Consumption monitor capable of obtaining energy consumption and uploading to Adafruit.io.
You can also check out the Arduino based IoT Energy Meter and the Prepaid GSM Energy Meter that we have built earlier.
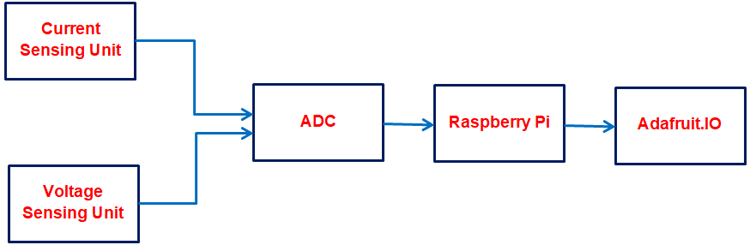
Raspberry Pi Smart Energy Meter Block Diagram
A block diagram showing how the system works is shown below.
To pick the units one after the other;
Current Sensing Unit: The Current sensing unit is made up of the SCT -013 current sensor that can measure up to 100A, depending on the version you buy. The sensor transforms the current passing through the wire on which it is clamped into a small current which is then fed into the ADC via a network of voltage dividers.
Voltage Sensing Unit: While I was unable to lay my hands on a voltage sensor module, We will build a DIY a transformerless voltage sensor that measures voltage using the principle of voltage dividers. The DIY voltage sensor involves the voltage divider stage where the high voltage is transformed to a value suitable for input to the ADC.
Processing Unit: The processing unit comprises the ADC and the Raspberry pi. The ADC takes the analog signal and sends it over to the raspberry pi, which then calculates the exact amount of power that is being consumed and sends it to a designated device cloud. For the purpose of this tutorial, we will be using Adafruit.io as our Device Cloud. We have also built other
Disclaimer: Before we begin, it is important to mention that this project involves connection to an AC supply which is dangerous, and could be fatal if not handled safely. Ensure you have experience working around AC before attempting this.
Ready? Let's dive in.
Required Components
The following components are required to build this project;
- Raspberry Pi 3 or 4 (the process should be the same for the RPI2 with a WiFi Dongle)
- ADS1115 16bit I2C ADC
- YHDC SCT-013-000
- 2.5A 5V MicroUSB Power Adapter
- 2W 10K Resistor (1)
- 1/2W 10K Resistor (2)
- 33ohms Resistor (1)
- 2W 3.3k Resistor (1)
- IN4007 Diode (4)
- 3.6v Zener Diode (1)
- 10k Potentiometer(or Preset) (1)
- 50v 1uf Capacitor
- 50v 10uf Capacitor (2)
- BreadBoard
- Jumper Wire
- Other Accessories for Raspberry Pi’s Use.
Asides the hardware components listed above, the project also requires some software dependencies and libraries that we will install as we go on.
While this tutorial will work irrespective of the raspberry pi OS used, I will be using the Raspberry Pi buster OS running on a Pi 3 (should also work on a Pi 4) and I will assume you are familiar with setting up the Raspberry Pi with the Raspbian Buster OS (pretty much the same process as the previous versions), and you know how to SSH into it using a terminal software like hyper. If you have issues with any of this, there are tons of Raspberry Pi Tutorials on this website that can help
Preparing the Pi
Before we start wiring up the components and coding, there are some simple tasks we need to perform on the raspberry pi to make sure we are ready to go.
Step 1: Enabling the Pi I2C
At the core of today’s project is not just the raspberry pi but the ADS1115 16bit I2C-based ADC. The ADC allows us to connect analog sensors to the Raspberry Pi since the Pi itself does not have an inbuilt ADC. It takes in the data through its own ADC and forwards it to the raspberry pi via I2C. As such, we need to enable I2C communication on the Pi so it can communicate with it.
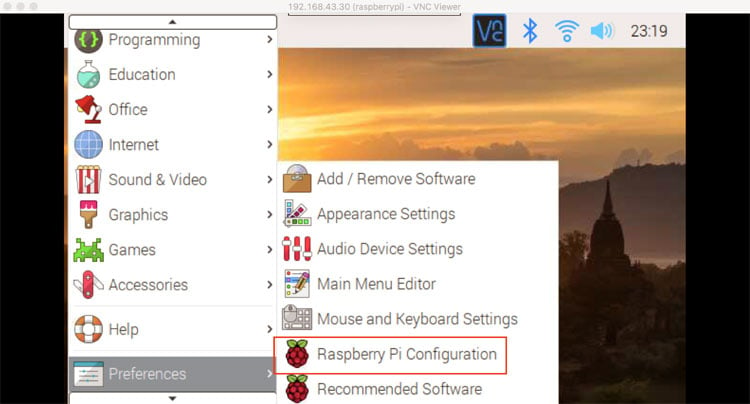
The Pi’s I2C bus can be enabled or disabled via the raspberry pi’s config page. To launch it, Click on the Pi Icon on the desktop and select preferences followed by Raspberry pi configuration.
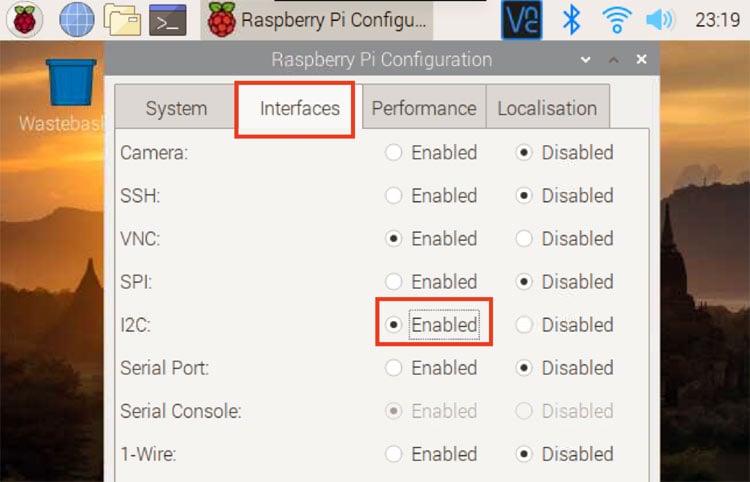
This should open the config page. Check the enabled radio button for the I2C and click on OK to save it and reboot the Pi to effect the changes.
If you are running the Pi in headless mode, the Raspbian configuration page can be accessed by running sudo raspi-config.
Step 2: Installing the ADS11xx library from Adafruit
The second thing we need to do is to install the ADS11xx python library which contains functions and routines that make it easy for us to write a python script to fetch values from the ADC.
Follow the steps below to do this.
- Update your pi by running; sudo apt-get update followed by sudo apt-get upgrade this will update the pi ensuring there are no compatibility issues for any new software you choose to install.
- Next, run the cd ~ command to ensure you are in the home directory.
- Next, install the build-essentials by running; sudo apt-get install build-essential python-dev python-smbus git
- Next, clone the Adafruit git folder containing the ADS library by running; git clone https://github.com/adafruit/Adafruit_Python_ADS1x15.git
- Change into the cloned file’s directory and run the setup file using; cd Adafruit_Python_ADS1x1z followed by sudo python setup.py install
With this done, the installation should now be complete.
You can test the library installation by connecting the ADS1115 as shown in the schematics section below and run the sample code that came with the library by first, changing into its folder using; cd examples and running the example using; python simpletest.py
Step 3: Install Adafruit.IO Python Module
As mentioned during the introductions, we will be publishing readings from the voltage and current sensors to the Adafruit IO Cloud from which it can be viewed from all over the world or connected with IFTTT to perform whatever actions you desire.
The Adafruit.IO python module contains subroutines and functions that we will leverage on, to easily stream data to the cloud. Follow the steps below to install the module.
- Run the cd ~ to return to the home directory.
- Next, run the command; sudo pip3 install adafruit-io. It should install the Adafruit IO python module.
Step 4: Setup Your Adafruit.io Account
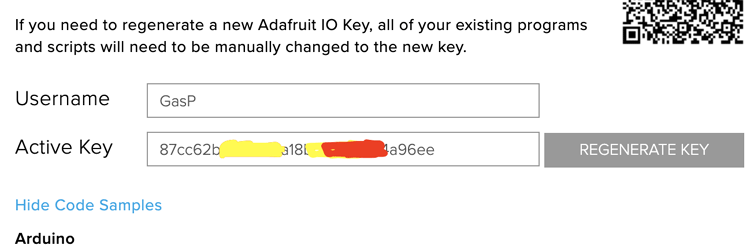
To use Adafruit IO will definitely need to first create an account and obtain an AIO key. This AIO key along with your username will be used by your python script to access the Adafruit IO cloud service. To create an account, visit; https://io.adafruit.com/, click on the get started for free button and fill in all the required parameters. With Sign up complete, you should see the View AIO Key button on the right of your home page.
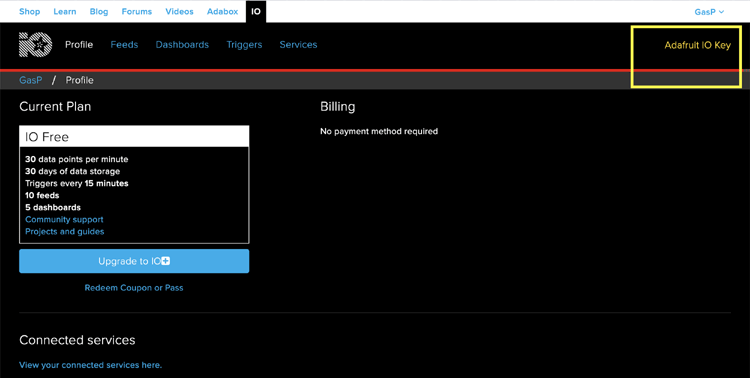
Click on it to get your AIO key.
With the key copied, we are ready to go. However, to make the process of sending data to the cloud service easier, you can also create the feeds to which data will be sent. (more info on what AIO feeds are can be found here ). Since we will basically be sending Power consumption, we will create a feed for power. To create a feed, click on “feeds” at the top of the AIO page and click on add new feed.
Give it whatever name you want but to keep things simple, I will be calling it energy consumption. You can also decide to create feeds for voltage and current and adapt the code to publish data to them.
With all of this in place, we are now ready to start building the project.
Pi Energy Meter Circuit Diagram
The schematics for the Raspberry Pi Energy Monitor project is relatively complex and it involves connecting to an AC voltage as mentioned earlier, kindly ensure you take all precautions necessary to avoid electric shock. If you are not familiar with safely handling AC voltages, let the joy of implementing this on a breadboard, without powering it, be satisfactory.
The schematics involve connecting the voltage and current sensors unit to the ADC which then sends the data from the sensors to the Raspberry Pi. To make the connections easier to follow, the schematics for each unit is presented on its own.
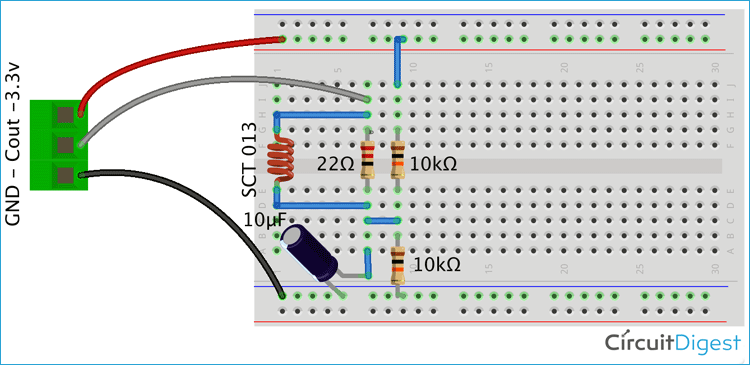
Current Sensor Schematic
Connect components for the current sensor as shown in the schematics below.
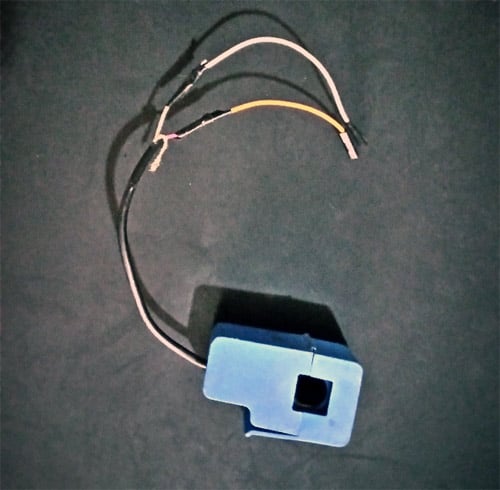
The current transformer used in this project is shown below, as you can see we have three wires from it, namely ground, Cout and 3.3V
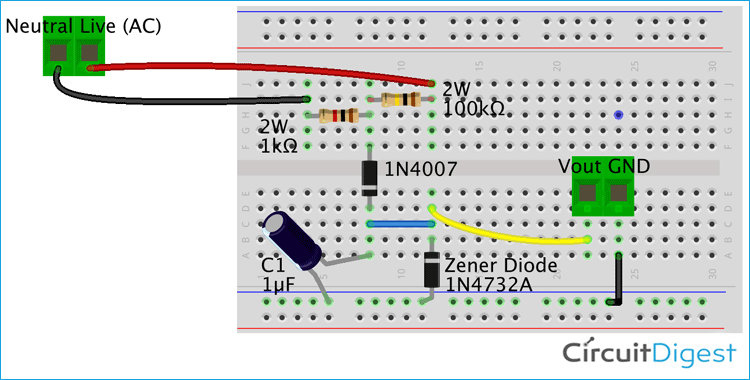
Voltage Sensor Schematics
Connect components for the voltage sensor as shown in the schematics below.
Processing unit Schematics
Connect everything together with the ADC(ADS1115) connected to the raspberry pi and the output of the current and voltage sensors connected to pin A0 and A1 of the ADS1115 respectively.

Ensure the GND pins of both sensing units are connected to the GND of the ADC or the raspberry pi.
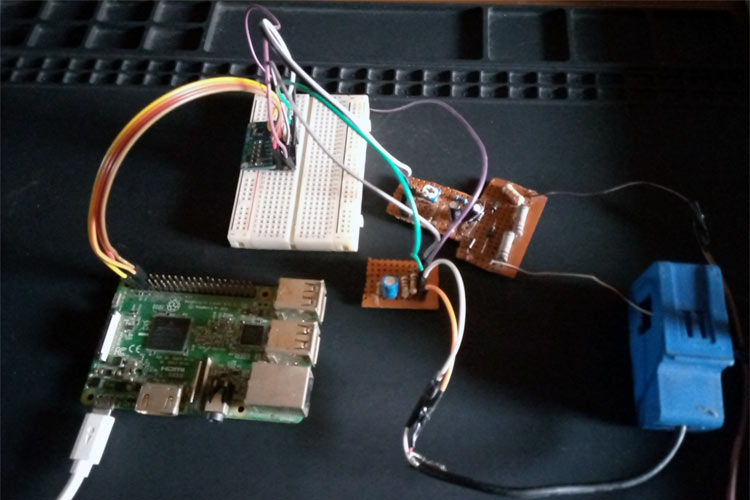
To make things a bit less shaky, I implemented the voltage and current sensors on a Protoboard. Also, it is not recommended to build an AC mains circuit on the breadboard. If you do the same, your final setup might look like the image below;
With the connections complete, we are now ready to write the code for the project.
Python Code for Pi Energy Meter
As usual with our raspberry pi projects, we will develop the code for the project using python. Click on the raspberry pi icon on the desktop, select programming and launch whichever version of python you want to use. I will be using Python 3 and some of the functions in python 3 may not work for python 2.7. So there might be a need to make some significant change to the code if you want to use python 2.7. I will do a breakdown of the code into small snippets and share the complete code with you at the end.
Ready? Cool.
The algorithm behind the code is simple. Our python script queries the ADS1115(over I2C) for voltage and current readings. The received analog value is received, sampled and the root mean square value of the voltage and current are obtained. The power in kilowatts is calculated and sent to the Adafruit IO feed after specific intervals.
We start the script by including all the libraries that we will be using. This includes in-built libraries like the time and math library and the other libraries we installed earlier.
import time
import Adafruit_ADS1x15
from Adafruit_IO import *
import math
Next, we create an instance of the ADS1115 library which will be used to address the physical ADC going forward.
# Create an ADS1115 ADC (16-bit) instance..
adc1 = Adafruit_ADS1x15.ADS1115()
Next, provide your adafruit IO username and “AIO” key.
username = ‘enter your username in between this quotes’
AIO_KEY = 'your aio key'
aio = Client(username, AIO_KEY)
Please keep the key safe. It can be used to access your adafruit io account without your permission.
Next, we create some variables like the gain for the ADC, the number of samples we want and set the rounding which is definitely not critical.
GAIN = 1         # see ads1015/1115 documentation for potential values.
samples = 200      # number of samples taken from ads1115
places = int(2)    # set rounding
Next, We create a while loop to monitor the current and voltage and send the data to Adafruit io at intervals. The while loop starts by setting all the variables to zero.
while True:
    # reset variables
    count = int(0)
    datai = []
    datav = []
    maxIValue = 0 #max current value within sample
    maxVValue = 0 #max voltage value within sample
    IrmsA0 = 0 #root mean square current
    VrmsA1 = 0 # root mean square voltage
    ampsA0 = 0 #current peak
    voltsA1 =0  #voltage
    kilowatts = float(0)
Since we are working with AC circuits the output of SCT-013 and the voltage sensor will be a sinewave, thus In order to calculate the current and voltage from sine wave, we will need to get the peak values. To get the peak values, we will sample both voltage and current (200 samples), and find the highest values(peak values).
      for count in range(samples):
        datai.insert(count, (abs(adc1.read_adc(0, gain=GAIN))))
        datav.insert(count, (abs(adc1.read_adc(1, gain=GAIN))))
        # see if you have a new maxValue
        print (datai[count])
        if datai[count] > maxIValue:
            maxIValue = datai[count]
        if datav[count] > maxVValue:
            maxVValue = datav[count]
Next, we standardize the values by converting from the ADC values to the actual value after which we then use the Root Mean Square equation to find the RMS voltage and current.
 #calculate current using the sampled data
    # the sct-013 being used is calibrated for 1000mV output @ 30A.
    IrmsA0 = float(maxIValue / float(2047) * 30)
    IrmsA0 = round(IrmsA0, places)
    ampsA0 = IrmsA0 / math.sqrt(2)
    ampsA0 = round(ampsA0, places)
    # Calculate voltage
    VrmsA1 = float(maxVValue * 1100/ float(2047))
    VrmsA1 = round(VrmsA1, places)
    voltsA1 = VrmsA1 / math.sqrt(2)
    voltsA1 = round(voltsA1, places)
    print('Voltage: {0}'.format(voltsA1))
    print('Current: {0}'.format(ampsA0))
With this done, the power is calculated and the data is published on adafruit.io
    #calculate power
    power = round(ampsA0 * voltsA1,places)
    print('Power: {0}'.format(power))
   #post data to adafruit.io
   EnergyUsage = aio.feeds('EnergyUsage')
  aio.send_data('EnergyUsage’, power)
For free accounts, adafruit demands that there is some time delay between requests or data upload.
   # Wait before repeating loop
    time.sleep(0)
The complete code for the project is available at the bottom of this page

Demo
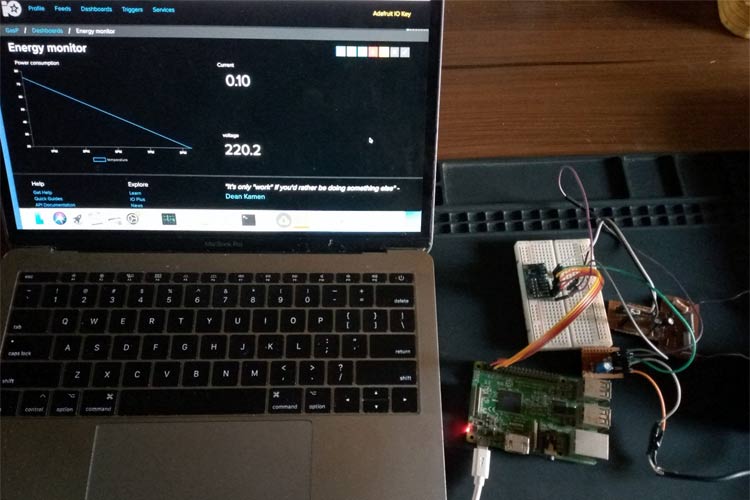
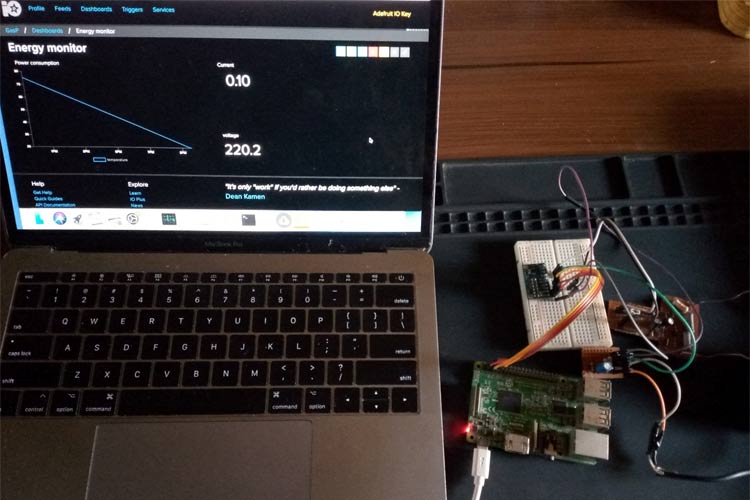
With the code complete, save it and hit the run button on the python IDE. Before this, ensure the Pi is connected to the internet via WiFi or LAN, and your aio key and username are correct. After a while, you should begin to see the energy data (power) displayed on the feed on Adafruit.io. My hardware setup during the demo was like this
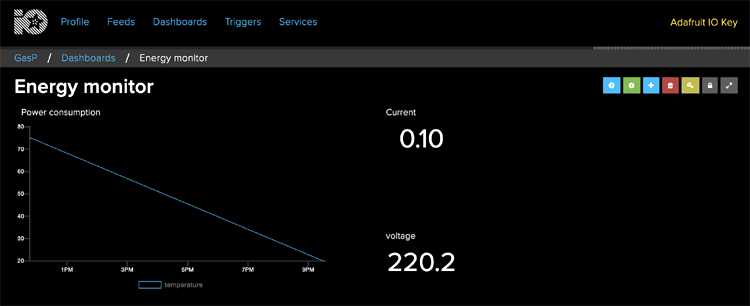
To take things further, you could create a dashboard on adafruit.io and add a graph component so you can get a graphical view of the data as shown in the image below.
That’s it guys, you can now monitor your energy consumption from anywhere in the world. It is important to note that there is definitely a lot more fine-tuning and calibrations to be done to transform it into a really accurate solution, but I believe this gives you almost everything you need to proceed.
Feel free to shoot me questions about the project via the comment section. I will try to answer as many as possible. Till next time.
Complete Project Code
#!/usr/bin/env python3
import time
import Adafruit_ADS1x15
from Adafruit_IO import *
import math
# Create an ADS1115 ADC (16-bit) instance..
adc1 = Adafruit_ADS1x15.ADS1115()
username = ‘your-user-name'
AIO_KEY = 'your-aio-key’
aio = Client(username, AIO_KEY)
GAIN = 1         # see ads1015/1115 documentation for potential values.
samples = 5      # number of samples taken from ads1115
places = int(2)    # set rounding
# create a while loop to monitor the current and voltage and send to Adafruit io.
while True:
    # reset variables
    count = int(0)
    datai = []
    datav = []
    maxIValue = 0
    maxVValue = 0
    IrmsA0 = 0
    VrmsA1 = 0
    ampsA0 = 0
    voltsA1 =0
    kilowatts = float(0)
    # since we are measuring an AC circuit the output of SCT-013 wand the voltage sensor will be a sinewave.
    # in order to calculate amps from sinewave we will need to get the peak voltage
    # from each input and use root mean square formula (RMS)
    # this loop will take 200 samples from each input and give you the highest (peak)
    for count in range(5):
        datai.insert(count, (abs(adc1.read_adc(0, gain=GAIN))))
        datav.insert(count, (abs(adc1.read_adc(1, gain=GAIN))))
        # see if you have a new maxValue
        print (datai[count])
        if datai[count] > maxIValue:
            maxIValue = datai[count]
        if datav[count] > maxVValue:
            maxVValue = datav[count]
            print("new maxv value:")
            print(maxVValue)
    #calculate current using the sampled data
    # I used a sct-013 that is calibrated for 1000mV output @ 30A. Usually has 30A/1V printed on it.
    print("proceeding")
    IrmsA0 = float(maxIValue / float(2047) * 30)
    IrmsA0 = round(IrmsA0, places)
    ampsA0 = IrmsA0 / math.sqrt(2)  # RMS formula to get current reading to match what an ammeter shows.
    ampsA0 = round(ampsA0, places)
    # Calculate voltage
    VrmsA1 = float(maxVValue * 1100/ float(2047))
    VrmsA1 = round(VrmsA1, places)
    voltsA1 = VrmsA1 / math.sqrt(2)  # RMS formula to get voltage reading to match what an voltmeter shows.
    voltsA1 = round(voltsA1, places)
    print('Voltage: {0}'.format(voltsA1))
    print('Current: {0}'.format(ampsA0))
    #calculate power
    power = round(ampsA0 * voltsA1,places)
    print('Power: {0}'.format(power))
    #post data to adafruit.io
    energyconsumption = aio.feeds('energyconsumption')
    aio.send_data('energyconsumption', power)
    # Wait before repeating loop
time.sleep(30)Comments
hello why u dont up
hello why u dont up Schematics 3 in here thanks
Sorry can't understand your
Sorry can't understand your question
can u have email ? I used
can u have email ? I used ACS712 and ADS1115 to measure current can u help me design circuit board for it, thanks
The second part from voltage
The second part from voltage Sensor Schematic is Voltage regulator ?
i used the same hardware…
i used the same hardware setup for arduino emonlib library and i get good current readings , but now i need to use python but im not getting good readings with this code.
Thanks

An interesting, project very nice if could you explain the formulation a bit further