Debugging is a vital element of the creative process when it comes to developing code. Arduino debugging, on the other hand, can be a little more difficult. One reason for this is that Arduino does not include a specialized debugging tool. However, the new Arduino IDE pro has a debugging tool with it. So, let’s see what kind of debugging tools are available for the Arduino Uno programming. The procedure of programming the Arduino is so simple but when it comes to debugging and writing a good code you need to know how many ways are available to debug the Arduino. For the debugging, we have two options available in the Arduino IDE. These are Internal Debugging tools and External Debugging Tools.
Internal Debugging Tools on the Arduino IDE
We have some internal features on Arduino IDE to debug a code. We can use the compiler, Serial Monitor, Serial Plotter, or even on the Arduino IDE Pro, we have a Serial Debugger. Now, let’s discuss one by one about the Internal Debugging Tools.
Compiler
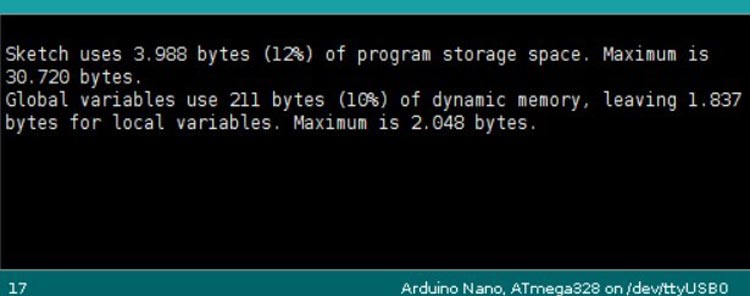
We have a compiler on the Arduino IDE but it can be used to check any warning or errors when we have completed our code. If you receive a compilation error when attempting to compile or upload code to your board, check for syntax, typos, and other problems. Using the proper syntax is critical to ensuring that your code compiles. When compilation fails, the IDE will display the problems at the bottom of the screen. The error messages provided by the Arduino IDE, on the other hand, are restricted in their description and hence not always particularly helpful. If you understand what the error message implies, consider resolving the issue it suggests and recompiling. This is a quick way to debug an Arduino.
Serial Monitor
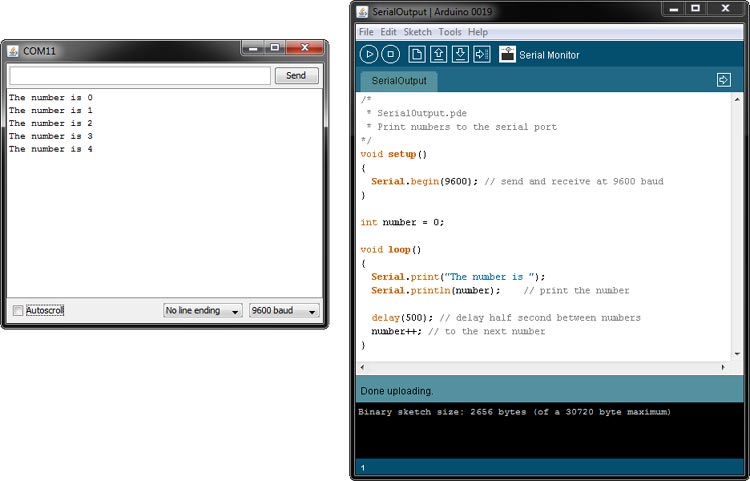
As previously said, if your code fails when you try to run your sketch, you must begin troubleshooting it. First, decide which parameters to output and utilize the serial monitor to keep track of them on-screen (You can learn the basics of serial print here). The goal is to print a summary of the program's present status. As an example:
- Variables
- Inputs – sensor readings
- Prints that indicate the programs flow, like inside an ‘if’ statement to see whether the condition was met
- Outputs – e.g. PWM values before writing them to the pin
- Anything else you find important to print to screen
Arduino IDE Pro Including the Debugging Tools
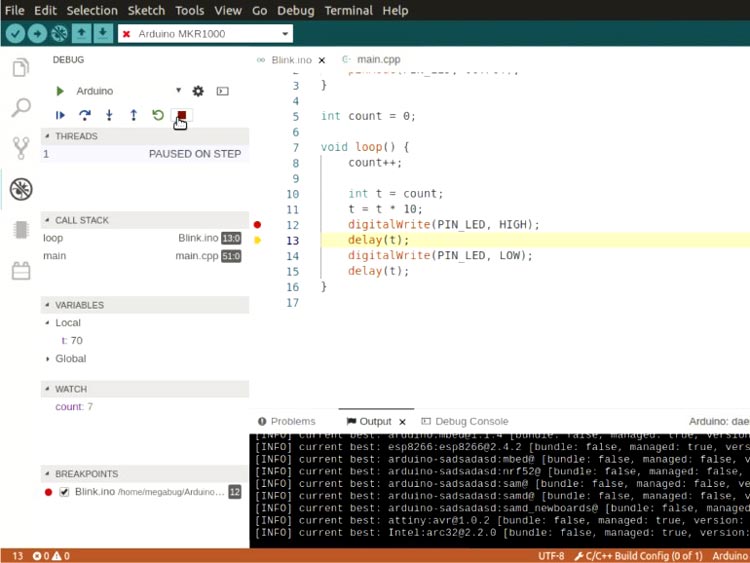
Arduino IDE Pro has a debugging tool that can be used to enhance debugging skills. It has the following features which make it very useful to the developers.
New features including:
- Code indentation
- Block folding
- Auto-closing brackets
- Regular expression search and replace
- Comment toggling
- Other additional features are live debugging, autocompletion, responsive interface, and faster compilation time.
External Debugging Tools for the Arduino IDE
If you manually examine your code and still can't discover the issue, it's time to utilize a sophisticated debugging tool. Unlike many IDEs, Arduino does not have its own inbuilt debugging tool. There are, however, a variety of other tools you may use to ensure that your code is executing properly. If you want extensive debugging and simulation capabilities, the following are some of the finest tools to consider:
Visual Micro
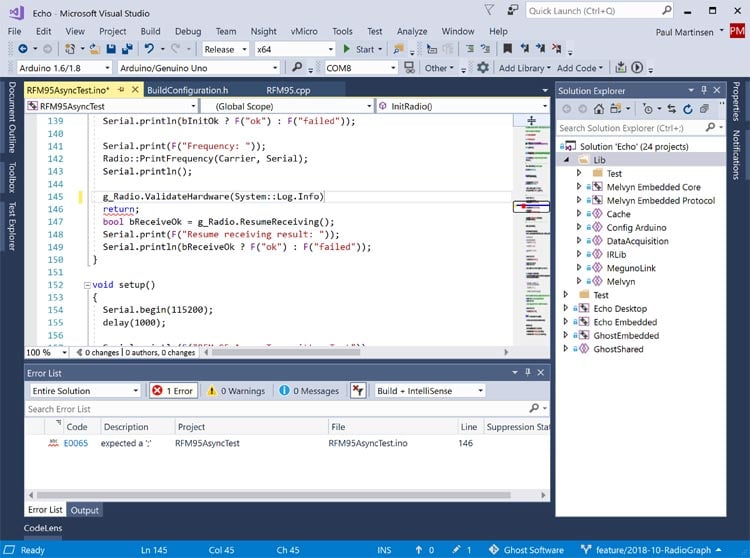
Visual micro is a Microsoft Visual Studio plugin that allows you to develop cross-platform Arduino applications. Any code written in Visual Micro that complies with Arduino specifications will be approved. Because it allows for shared code and library modification, Visual Micro is ideal for collaborative Arduino debugging teams. Code from multiple platforms can be produced and integrated with programme code during the compilation process. Visual Micro also provides GDB debugging, as well as serial, Bluetooth, and WiFi debugging.
DebugWire
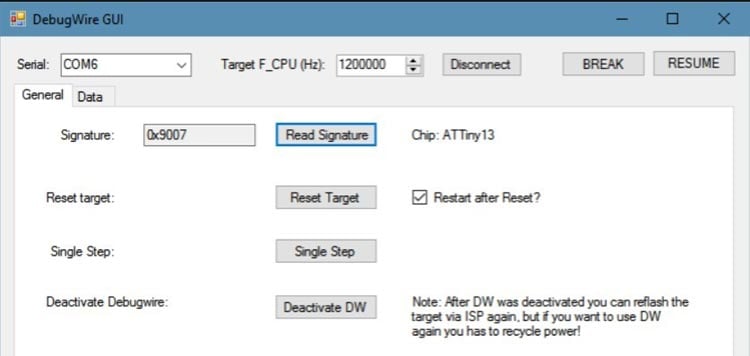
DebugWire is an Atmel protocol that allows you to debug multiple ATTiny (e.g., ATTiny 13, 85) and ATmegas (e.g., ATmega48/88/168/328) without using JTAG and just using the Reset pin. Atmel does not document the DebugWire protocol, however, some folks reverse engineered large sections of it and were able to construct some basic debuggers. DebugWIRE provides full read and write access to the entire memory as well as complete control over the execution flow. It supports the following instructions: single-step, run-to-cursor, step-out, and software break.
Atmel Studio
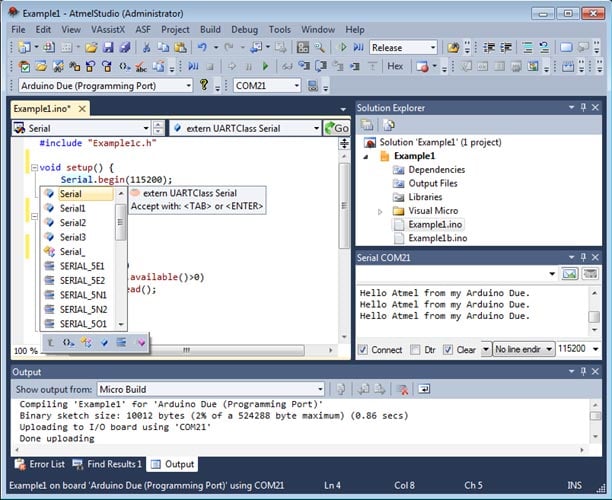
Atmel Studio IDE is a free Programme that provides competitive debugging capabilities to assist in the resolution of code problems. A project may be designed, compiled, and uploaded to the appropriate microprocessor using Atmel Studio. Atmel Studio's IDE, like the Arduino IDE, uses the same code, so you don't need to learn a new programming language to use it. For the open-source community, Atmel is highly adaptable and supports.ino drawings as well as C++ source codes. Atmel Studio also has excellent debugging capabilities through DebugWire or JTAG.
So, these are the basics steps that you can follow to debug while writing an Arduino Code. You can try out those features of the debugging tools while making your Arduino Projects.