By Yash Chipkar
We all dread the moment our monthly electricity bill arrives. It’s often a shock—a single, confusing number with zero explanation of where that energy went. Was it the air conditioner running too long? A faulty refrigerator? Or phantom electronics draining power in standby mode? For the CircuitDigest Smart Home and Wearables Project Contest 2025, We built the Smart Power Management System to solve this exact problem. Our goal was simple: demystify the electricity bill by giving users real-time visibility into their consumption, appliance by appliance.
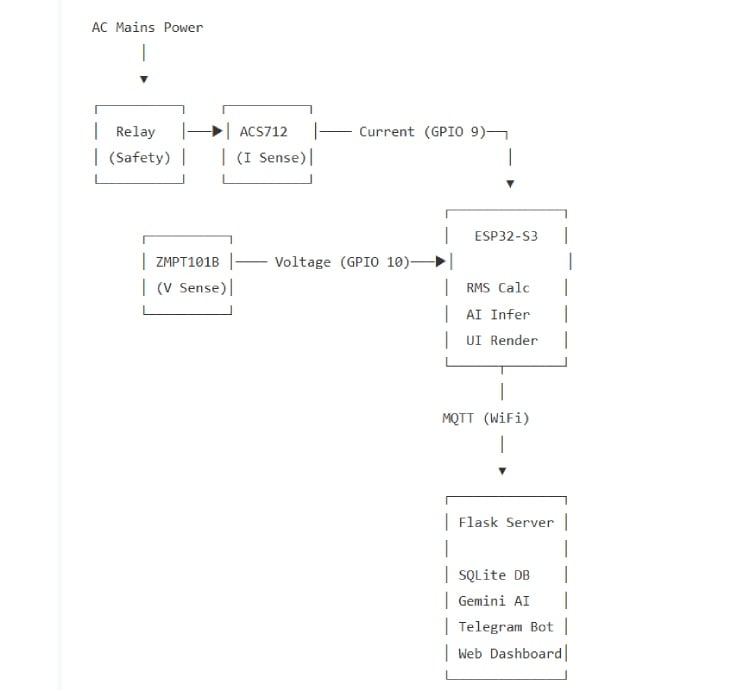
This project transforms a standard electrical outlet into an intelligent energy monitor. Powered by the ESP32-S3-BOX-3, it tracks voltage, current, and wattage in real-time, breaking down costs instantly on a beautiful touchscreen display. But it goes beyond just monitoring—it uses Google Gemini AI to act as a personal "Energy Analyst," analyzing usage patterns to explain your bill in plain English and suggesting actionable ways to save money. Combined with Edge AI safety features that can detect electrical faults and cut power in milliseconds, this system doesn't just help you understand your energy bill—it helps you lower it, safely.
Components Required
| Component Name | Quantity | Datasheet/Link |
| Esp32-S3-Box-3 | 1 | View Datasheet |
| ZMPT101B AC Voltage Sensor Module | 1 | - |
| ACS712 Current Sensor Module | 1 | - |
| 5V 1 Channel Relay Module | 1 | - |
| 11.1v 4200mAh 35C 3S1P Bonka LiPo Battery | 1 | - |
| 12v to 5v UBEC convertor | 1 | - |
| Philips 60W 240V Dimmable Incandescent Light Bulb | 1 | - |
| 4 Step Fan Regulator | 1 | - |
Circuit Diagram

Hardware Assembly
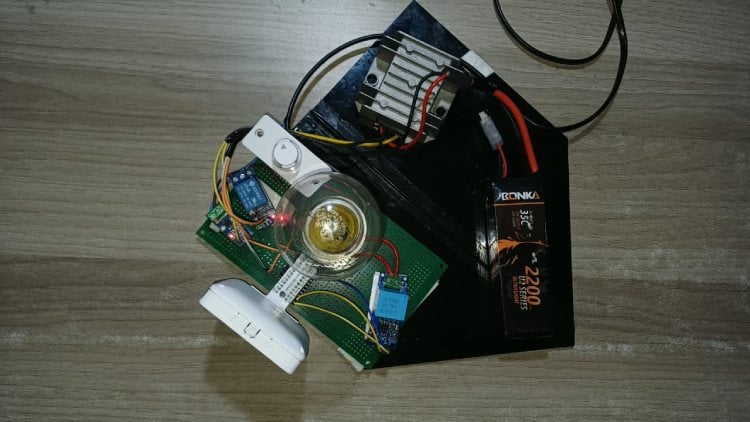
Here is a detailed, step-by-step guide on how to wire everything together, broken down by voltage levels to ensure safety.
Phase 1: Low Voltage Power Distribution
This sets up the safe power for your sensors and relay.
Prepare the Power Source:
- Take your 12V LiPo Battery.
- Connect the battery terminals to the input of your UBEC.
- Check: The UBEC should now be outputting a stable 5V.
Powering the Relay & ACS712:
- Connect UBEC 5V Output (+) to:
- VCC on the ACS712 sensor.
- VCC on the Relay Module.
- Connect UBEC GND (-) to:
- GND on the ACS712.
- GND on the Relay Module.
- GND on your ESP32-S3-BOX-3 (This is critical—common ground!).
Powering the ZMPT101B (Voltage Sensor):
- Connect ESP32 3.3V pin to VCC on the ZMPT101B.
- Connect ESP32 GND pin to GND on the ZMPT101B.
Phase 2: Signal Connections
This connects the sensors and relay logic to the ESP32.
Connecting the Sensors:
- ACS712 OUT pin → Connect to ESP32 GPIO 9.
- ZMPT101B OUT pin → Connect to ESP32 GPIO 10.
Connecting the Relay Control (The Transistor Switch):
We need a transistor because the relay is 5V, but the ESP32 is 3.3V.
- Take your NPN Transistor (e.g., 2N2222).
- Base (Middle Pin):
- Connect a 1kΩ resistor to this pin.
- Connect the other end of the resistor to ESP32 GPIO 40.
- Emitter (Left Pin, usually):
- Connect directly to GND.
- Collector (Right Pin, usually):
- Connect to the IN pin on the Relay Module.
Phase 3: High Voltage AC Mains Wiring (DANGER!)
Make sure the AC plug is UNPLUGGED while doing this.
The Main Logic:
- Imagine the Live (Phase/Red) wire coming from the wall plug and going to your appliance.
- We are going to cut this wire and put our sensors in the middle.
Wiring the Relay (The Safety Switch):
- Cut the Live wire.
- Connect the side coming from the Wall Plug to the COM (Common) screw terminal on the Relay.
- Connect a new wire from the NO (Normally Open) screw terminal on the Relay to the ACS712.
Wiring the Current Sensor (ACS712):
- Connect the wire coming from the Relay NO into one side of the ACS712 terminal block.
- Connect the other side of the ACS712 terminal block to your Appliance's Live input.
Effectively, AC flows: Wall → Relay → ACS712 → Appliance.
Wiring the Voltage Sensor (ZMPT101B):
- This needs to measure the voltage across the lines.
Take two extra wires. - Connect one to the Live wire (you can tap it at the Relay COM or the ACS712 input).
- Connect the other to the Neutral wire (the one that goes directly from Wall to Appliance).
- Screw these into the ZMPT101B blue terminal block.
Neutral Wire:
- The Neutral (Black/Blue) wire goes directly from the Wall Plug to the Appliance.
- It does not go through the Relay or ACS712.
Code Explanation
The codebase is split into three independent layers: Firmware (ESP32-S3), Backend (Python/Flask), and ML Pipeline (TensorFlow). Each layer is designed to work independently, so the device remains safe even if the cloud is offline.
System Block Diagram
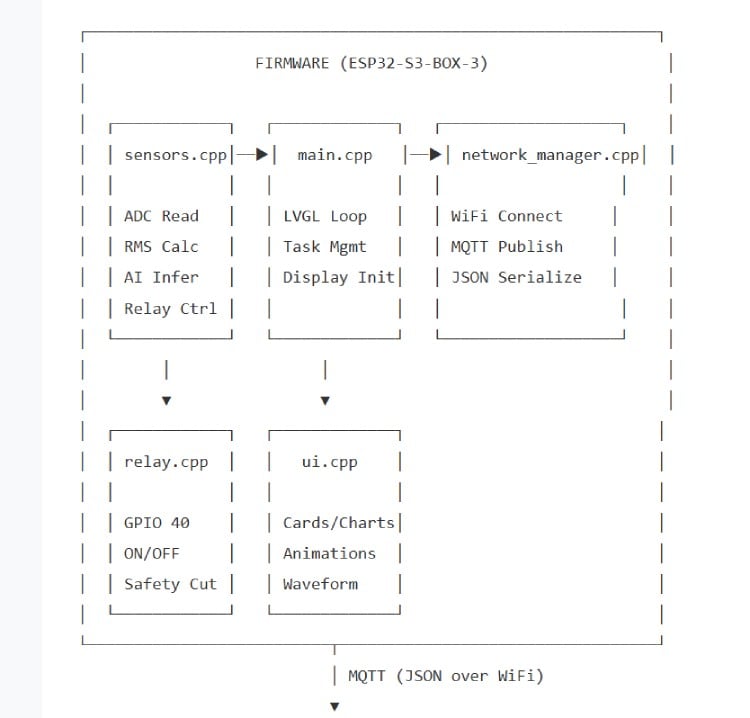
Firmware Layer (Embedded C++)
The firmware runs on FreeRTOS with a dual-core architecture. Core 0 handles all time-critical sensor operations, while Core 1 handles the UI and network communication.
main.cpp — Entry Point & Orchestration
- Initializes the LovyanGFX display driver for the ESP32-S3-BOX-3's built-in 2.4" ILI9341 LCD.
- Runs a Red → Green → Blue color test sequence on boot to verify display hardware.
- Sets up LVGL (Light and Versatile Graphics Library) with a 320×240 display buffer and touch input driver.
- Creates the
- sensor_task pinned to Core 0 using xTaskCreatePinnedToCore(), ensuring sensor sampling never gets interrupted by UI rendering.
- The main loop() runs on Core 1 and handles LVGL tick processing, UI updates, and periodic MQTT publishing every 2 seconds.
sensors.cpp — The Brain of the System
- This is the most critical file. It performs three major functions: sensing, AI inference, and safety control.
- ADC Sampling: Reads 1000 samples from both the ACS712 (GPIO 9) and ZMPT101B (GPIO 10) sensors. Each sample is squared, accumulated, and then square-rooted to compute the true RMS value. This gives accurate readings for AC waveforms, not just peak values.
- Calibration: The ACS712 outputs 2.5V at zero current. The code subtracts a measured zero-point offset (calibrated at ~1.507V for the 3.3V ADC) and applies conversion factors (185mV/A for the 5A ACS712 variant, 300V/unit for the ZMPT101B).
- Noise Gate: Any current reading below 0.02A is forced to zero to eliminate phantom readings from electrical noise.
- Waveform Buffer: A 100-point circular buffer stores raw current ADC values for the oscilloscope-style waveform visualization on the LVGL display.
AI Inference Pipeline (inside sensors.cpp):
- The TFLite Micro model is loaded at boot from
- model_data.h (a C byte array auto-generated by the training pipeline).
- Every sensor cycle, it feeds [voltage, current, power] into the neural network.
- The model outputs probabilities for 4 classes: FAULT, IDLE, LEVEL_1, LEVEL_2.
- The highest-probability class is selected and its label is pulled from
class_map.h. - If the class is FAULT or if raw current exceeds the hard threshold of 0.35A, the system immediately triggers the safety relay.
relay.cpp — Safety Actuator
- Controls a single GPIO pin (GPIO 40) connected to an NPN transistor that drives the relay coil.
- relay_on() sets GPIO 40 HIGH → transistor conducts → relay energizes → power flows to the load.
- relay_off() sets GPIO 40 LOW → transistor cuts off → relay de-energizes → power is physically disconnected.
- Once tripped by a fault, the relay latches OFF (a boolean relay_tripped flag prevents automatic re-energization). It can only be reset via a serial RESET command or power cycle. This is a deliberate safety design to prevent repeated connection to a faulted circuit.
ui.cpp — Touchscreen Dashboard
- Builds a full glassmorphism-style dashboard using LVGL widgets.
- Status Card: Displays the current AI classification with color-coded background (Green = IDLE, Yellow = Level 1, Orange = Level 2, Red = FAULT).
- Metrics Cards: Three cards showing live Voltage (V), Current (A), and Power (W) values with smooth label transitions.
- Neural Waveform Chart: A real-time line chart that plots the last 100 raw current ADC samples, creating an oscilloscope-like visualization directly on the ESP32 screen. Uses LVGL's lv_chart widget with the series updated from the waveform circular buffer.
- Animations: Smooth fade-in animations on boot using LVGL's animation API with custom timing curves.
network_manager.cpp — Cloud Communication
- Manages WiFi connection to the configured SSID/password from
secrets.h. - Establishes an MQTT connection to the public HiveMQ broker (broker.hivemq.com:1883).
- Implements automatic reconnection logic — if WiFi or MQTT drops, it retries every 5 seconds without blocking the sensor or UI tasks.
- Serializes telemetry data into a compact JSON payload using ArduinoJson: {"voltage": 230.1, "current": 0.15, "power": 34.5, "status": "LEVEL_1"}.
- Publishes to the topic digikey/power/telemetry every 2 seconds.
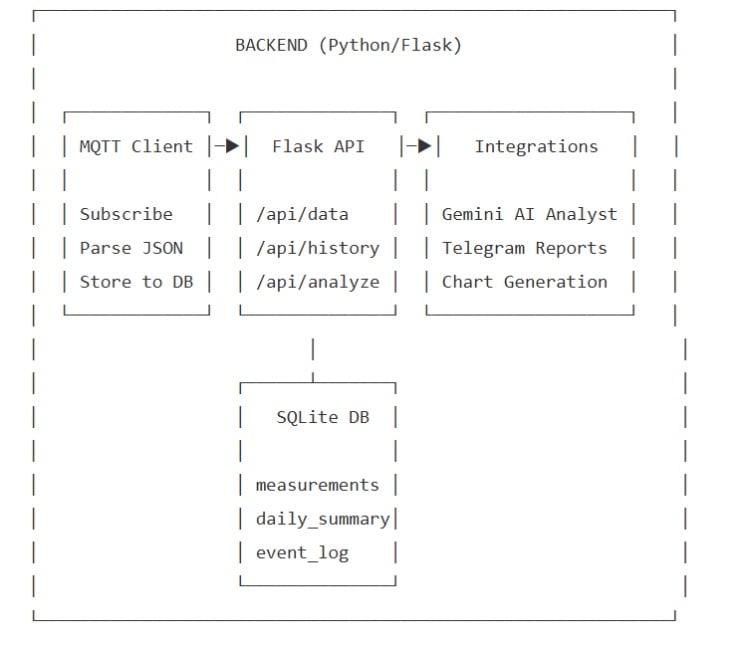
Backend Layer (Python)
server.py — The Central Hub
This single file runs the entire backend. It is structured into four major subsystems:
MQTT Subscriber:
- Connects to the same HiveMQ broker and subscribes to digikey/power/telemetry.
- Every incoming message is parsed from JSON, timestamped, and inserted into the SQLite database.
- Calculates cumulative energy consumption in real-time by integrating power over time: energy_kwh += (power × time_delta) / 3600000.
- Maintains a rolling in-memory buffer of the last 100 measurements for the live dashboard, and the last 50 system logs.
Flask REST API:
- GET /api/data — Returns the complete live state: current readings, session energy (kWh), today's total bill (₹), measurement history, and system event logs.
- GET /api/history — Queries the daily_summary table for the last 7 days of kWh consumption, used to render the bar chart on the dashboard.
- POST /api/analyze — Pulls the last 7 days of data from SQLite, formats it into a structured prompt, and sends it to the Google Gemini API. Gemini acts as an "AI Energy Analyst" and returns a formatted HTML response with health assessments, trend analysis, and savings recommendations. This is displayed directly in the dashboard.
- POST /api/notify — Generates a Matplotlib chart of daily consumption, saves it as a PNG, and sends it along with an AI-generated text summary to the user's Telegram chat via the Bot API.
- POST /api/record — Starts/stops ML dataset recording. When active, every incoming MQTT reading is appended to
- ml_dataset.csv with the user-specified label (e.g., "LEVEL_1", "FAULT"). This is how training data is collected from real sensors.
SQLite Database (3 tables):
- measurements — Every raw reading: timestamp, voltage, current, power, status.
- daily_summary — Aggregated daily totals: date, total kWh, peak power, number of readings, cost.
- event_log — System events: connections, disconnections, faults, alerts.
Web Dashboard (index.html):
- A single-page application served by Flask that uses vanilla JavaScript to poll /api/data every 2 seconds.
- Design: Dark theme with glassmorphism cards (semi-transparent backgrounds with backdrop blur), animated gradient orbs in the background, and the Space Grotesk font from Google Fonts.
- Charts: Two Chart.js instances — a real-time line chart for live power and a bar chart for daily kWh history.
- Interactive: Buttons to trigger AI analysis and Telegram reports, a recording control panel for ML data collection, and a live scrolling log console.
ML Pipeline (TensorFlow/Keras)
train_model.py — Model Training & Export
This script handles the complete machine learning lifecycle:
Data Loading & Augmentation:
- Loads the recorded dataset from
- ml_dataset.csv (columns: voltage, current, power, label).
- Augments the dataset with synthetic fault data — generates 200 samples with high current values (0.4A–2.0A) and random voltages, labeled as "FAULT". This ensures the model has enough fault examples even if real faults were rare during recording.
- Also generates synthetic samples for IDLE, LEVEL_1, and LEVEL_2 classes to balance the dataset.
Model Architecture:
Input (3 features: voltage, current, power)
↓
Dense Layer (16 neurons, ReLU activation)
↓
Dense Layer (8 neurons, ReLU activation)
↓
Output Layer (4 neurons, Softmax activation)
↓
Predicted Class: FAULT | IDLE | LEVEL_1 | LEVEL_2
Training:
- Uses an 80/20 train-test split with stratify to maintain class balance.
- Compiled with adam optimizer and sparse_categorical_crossentropy loss.
- Trained for 50 epochs with a batch size of 8.
- Achieves ~95% test accuracy.
Export Pipeline:
- Converts the trained Keras model to TFLite format using tf.lite.TFLiteConverter.
- Saves the binary
- .tflite file to
- backend/model.tflite.
- Auto-generates C header files for the firmware:
- model_data.h — The entire TFLite model as a const unsigned char[] array, ready to be compiled directly into the ESP32 firmware.
- class_map.h — A const char* CLASS_NAMES[] array mapping model output indices to human-readable labels.
- This means retraining the model and deploying it to the hardware is a single python train_model.py → pio run --target upload workflow.
Data Flow Summary