
As winter sets in, the air hanging over us thickens with smoke and gaseous emissions from burning fields, industrial factories, and vehicular traffic, blocking out the sun and making it hard to breathe. Experts say that the high levels of air pollution and COVID-19 pandemic can be a dangerous mix that can have serious consequences. The necessity for real-time monitoring of Air Quality is very glaring.
So in this project, we are going to build an ESP32 Air Quality Monitoring System using Nova PM SDS011 sensor, MQ-7 sensor, and DHT11 sensor. We will also be using an OLED Display module to display Air Quality Values. The Air Quality Index (AQI) in India is based on eight pollutants, PM10, PM2.5, SO2 and NO2, CO, Ozone, NH3, and Pb. However, it is not necessary to measure all of the pollutants. So we are going to measure the concentration of PM2.5, PM10, and Carbon Monoxide to calculate the Air Quality Index. The AQI values will be published on Adafruit IO so that we can monitor it from anywhere. Previously we have also measured the concentration of LPG, Smoke, and Ammonia gas using Arduino.
Components Required
- ESP32
- Nova PM Sensor SDS011
- 0.96’ SPI OLED Display Module
- DHT11 Sensor
- MQ-7 Sensor
- Jumper Wires
Nova PM Sensor SDS011 for Measuring PM2.5 and PM10
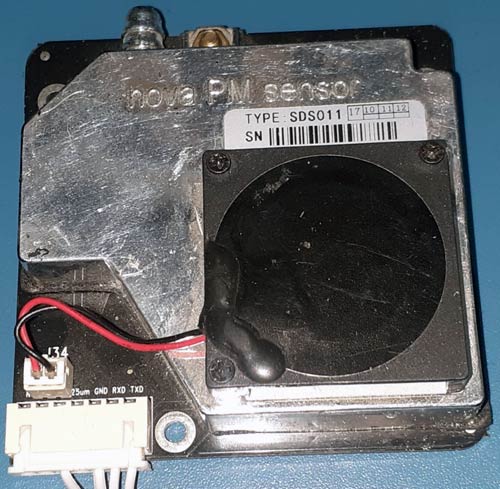
The SDS011 Sensor is a very recent Air Quality Sensor developed by Nova Fitness. It works on the principle of laser scattering and can get the particle concentration between 0.3 to 10μm in the air. This sensor consists of a small fan, air inlet valve, Laser diode, and photodiode. The air enters through the air inlet where a light source (Laser) illuminates the particles and the scattered light is transformed into a signal by a photodetector. These signals are then amplified and processed to get the particle concentration of PM2.5 and PM10. We previously used Nova PM Sensor with Arduino to calculate the concentration of PM10 & PM2.5.
SDS011 Sensor Specifications:
- Output: PM2.5, PM10
- Measuring Range: 0.0-999.9μg/m3
- Input Voltage: 4.7V to 5.3V
- Maximum Current: 100mA
- Sleep Current: 2mA
- Response Time: 1 second
- Serial Data Output Frequency: 1 time/second
- Particle Diameter Resolution:≤0.3μm
- Relative Error: 10%
- Temperature Range: -20~50°C
Basics of 0.96’ OLED Display Module
OLED (Organic Light Emitting Diode) is a kind of Light Emitting Diode that is made using organic compounds that excites when the electric current is allowed to flow through them. These organic compounds have their own light hence they don’t require any backlight circuitry like normal LCDs. Because of this reason, OLED display technology is power efficient and widely used in Televisions and other display products.
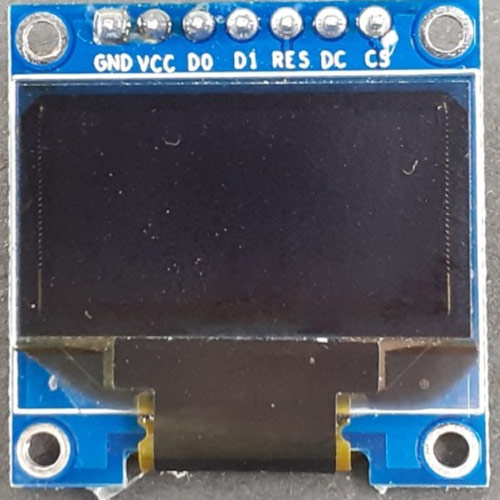
Various types of OLEDs are available in the market based on the color of the display, the number of pins, size, and controller IC. In this tutorial, we will use the Monochrome Blue 7-pin SSD1306 0.96” OLED module which is 128 pixels wide and 64 pixels long. This 7-pin OLED supports SPI protocol and controller IC SSD1306 helps the OLED to display the received characters. Learn more about OLED and its interfacing with different microcontrollers by following the link.
Preparing the MQ-7 Sensor to Measure Carbon Monoxide (CO)
MQ-7 CO Carbon Monoxide Gas Sensor Module detects the concentrations of CO in the air. The sensor can measure concentrations of 10 to 10,000 ppm. MQ-7 sensor can either purchased as a module or just as a sensor alone. Previously we have used many different types of Gas sensors to detect and measure various gas, you can also check them out if you are interested. In this project, we are using the MQ-7 sensor module to measure Carbon Monoxide concentration in PPM. The circuit diagram for the MQ-7 board is given below:
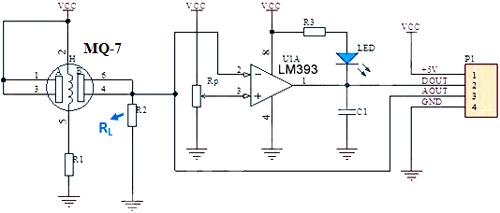
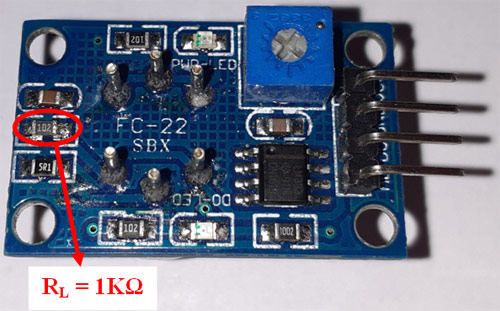
The load resistor RL plays a very important role in making the sensor work. This resistor changes its resistance value according to the concentration of gas. The MQ-7 sensor board comes with a Load resistance of 1KΩ that is useless and affects the sensor readings. So to measure the appropriate CO concentration values, you have to replace the 1KΩ resistor with a 10KΩ resistor.
Air Quality Index Calculation
The AQI in India is calculated based on the average concentration of a particular pollutant measured over a standard time interval (24 hours for most pollutants, 8 hours for carbon monoxide and ozone). For example, the AQI for PM2.5 and PM10 is based on 24-hour average concentration and AQI for Carbon Monoxide is based on 8-hour average concentration). The AQI calculations include the eight pollutants that are PM10, PM2.5, Nitrogen Dioxide (NO2), Sulphur Dioxide (SO2), Carbon Monoxide (CO), ground-level ozone (O3), Ammonia (NH3), and Lead (Pb). However, all of the pollutants are not measured at every location.
Based on the measured 24-hour ambient concentrations of a pollutant, a sub-index is calculated, which is a linear function of concentration (e.g. the sub-index for PM2.5 will be 51 at concentration 31 µg/m3, 100 at concentration 60 µg/m3, and 75 at a concentration of 45 µg/m3). The worst sub-index (or maximum of all parameters) determines the overall AQI.

Circuit Diagram
The circuit diagram for IoT Based Air Quality Monitoring System is very simple and given below:

SDS011 Sensor, DHT11, and MQ-7 sensor are powered with +5V while the OLED Display module is powered with 3.3V. The transmitter and Receiver pins of SDS011 are connected to GPIO16 & 17 of ESP32. The Analog Out pin of the MQ-7 sensor is connected to GPIO 25 and the data pin of the DHT11 sensor is connected to the GPIO27 sensor. Since the OLED Display module uses SPI communication, we have established an SPI communication between the OLED module and ESP32. The connections are shown in the below table:
|
S.No |
OLED Module Pin |
ESP32 Pin |
|
1 |
GND |
Ground |
|
2 |
VCC |
5V |
|
3 |
D0 |
18 |
|
4 |
D1 |
23 |
|
5 |
RES |
2 |
|
6 |
DC |
4 |
|
7 |
CS |
5 |
|
S.No |
SDS011 Pin |
ESP32 Pin |
|
1 |
5V |
5V |
|
2 |
GND |
GND |
|
3 |
RX |
17 |
|
4 |
TX |
16 |
|
S.No |
DHT Pin |
ESP32 Pin |
|
1 |
Vcc |
5V |
|
2 |
GND |
GND |
|
3 |
Data |
27 |
|
S.No |
MQ-7 Pin |
ESP32 Pin |
|
1 |
Vcc |
5V |
|
2 |
GND |
GND |
|
3 |
A0 |
25 |
Building the Air Quality Monitoring System Circuit on Perf Board
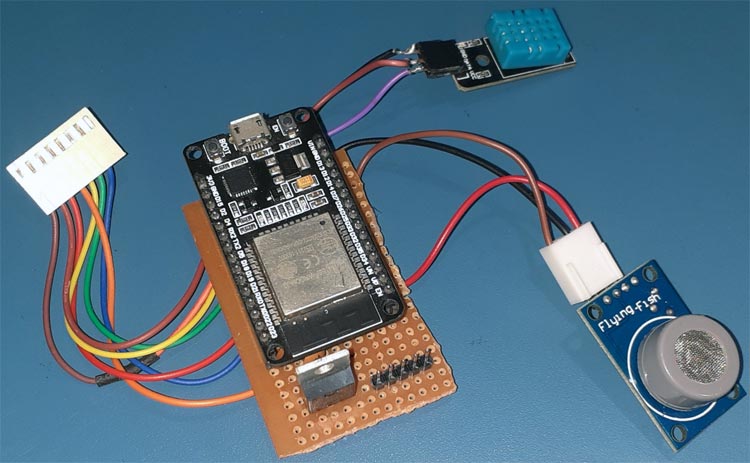
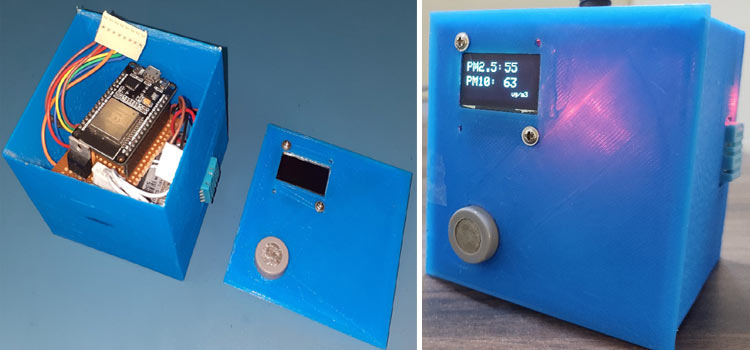
As you can see from the main image, the idea was to use this circuit inside a 3D Printed Casing. So the complete circuit shown above is soldered onto a perf board. Make sure to use wires to leave enough distance to mount the OLED and Sensors. My perf board soldered to OLED and the sensor module is shown below.
Adafruit IO Setup
Adafruit IO is an open data platform that allows you to aggregate, visualize, and analyze live data on the cloud. Using Adafruit IO, you can upload, display, and monitor your data over the internet, and make your project IoT enabled. You can control motors, read sensor data, and make cool IoT applications over the internet using Adafruit IO.
To use Adafruit IO, first create an account on Adafruit IO. To do this, go to the Adafruit IO website and click on ‘Get started for Free’ on the top right of the screen.

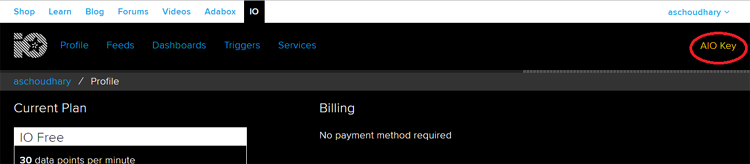
After finishing the account creation process, log in to the account and click on ‘View AIO Key’ on the top right corner to get the account username and AIO key.
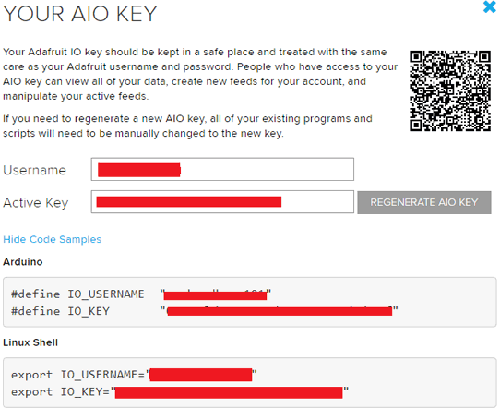
When you click on ‘AIO Key,’ a window will pop up with the Adafruit IO AIO Key and username. Copy this key and username, it will be used in code.
Now, after getting the AIO keys, create a feed to store the DHT sensor data. To create a feed, click on ‘Feed.’ Then click on ‘Actions,’ and then select ‘Create a New Feed’ from the available options.

After this, a new window will open where you need to input the Name and Description of the feed. Writing a description is optional.
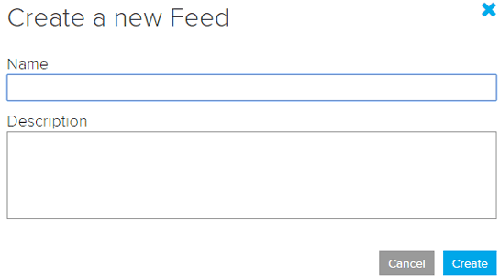
Click on ‘Create,’ after this; you will be redirected to the newly created feed.
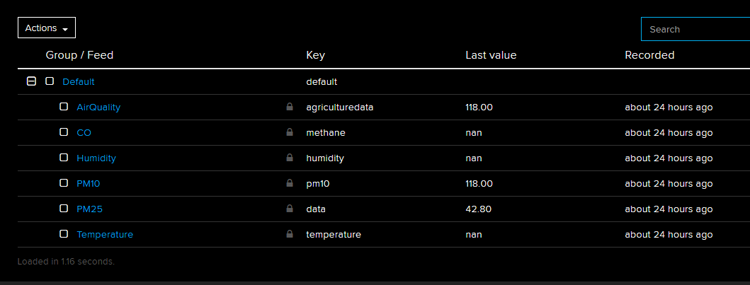
For this project, we created a total of six feeds for PM10, PM2.5, CO, Temperature, Humidity, and AQI values. Follow the same procedure as above to create the rest of the feeds.
After creating feeds, now we will create an Adafruit IO dashboard feature to visualize the sensor data on a single page. For that, first, create a dashboard and then add all these feeds in that dashboard.
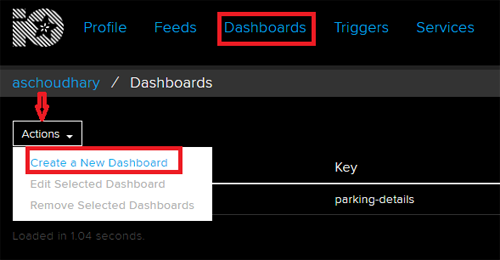
To create a dashboard, click on the Dashboard option and then click on the ‘Action,’ and after this, click on ‘Create a New Dashboard.’
In the next window, enter the name of the dashboard and click on ‘Create.’
As the dashboard is created, now we will use the Adafruit IO blocks like Gauge and Slider to visualize the data. To add a block, click on the ‘+’ in the top right corner.
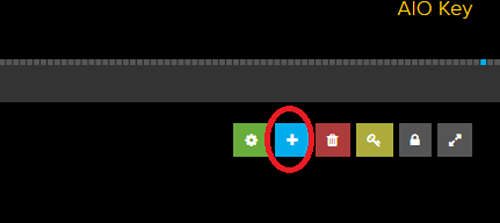
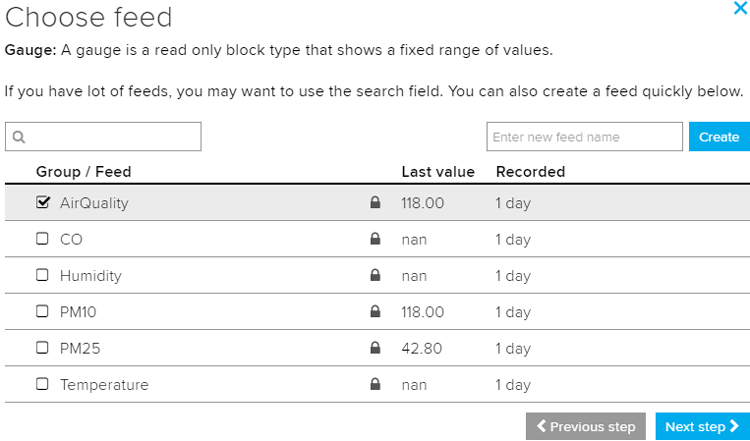
Then Select the ‘Gauge’ block.

In the next window, select the feed data that you want to visualize.
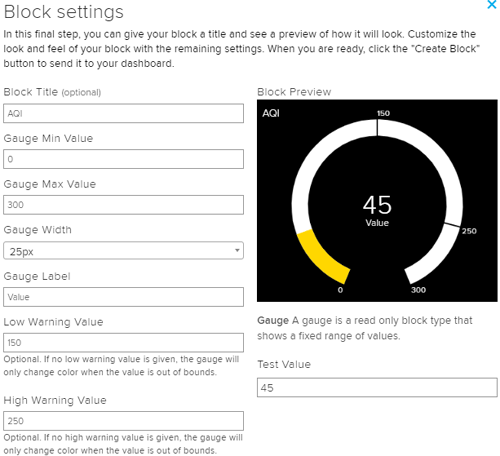
In the final step, change the block settings to customize it.
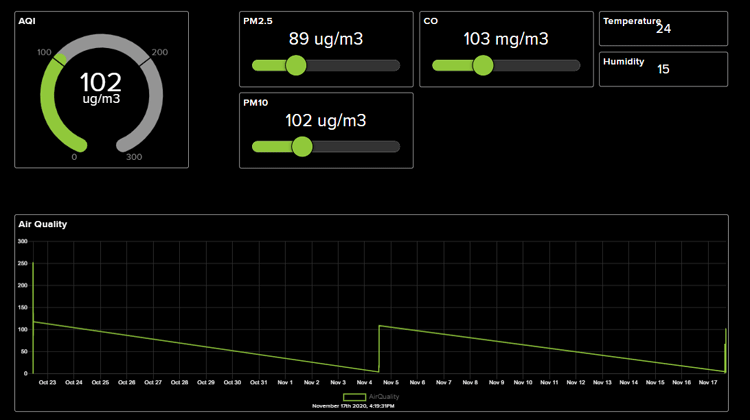
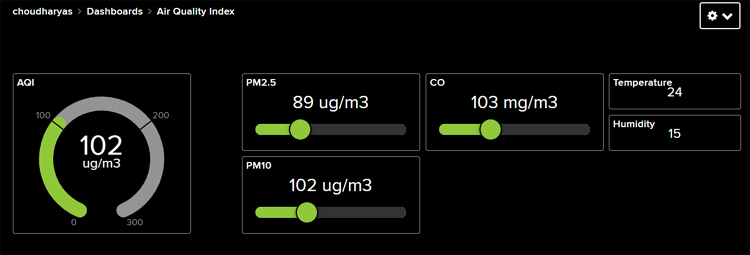
Now follow the same procedure as above to add visualization blocks for the rest of the feeds. My Adafruit IO Dashboard looked like this:
Code Explanation for IoT Based Air Quality Index Monitoring System
The complete code for this project is given at the end of the document. Here we are explaining some important parts of the code.
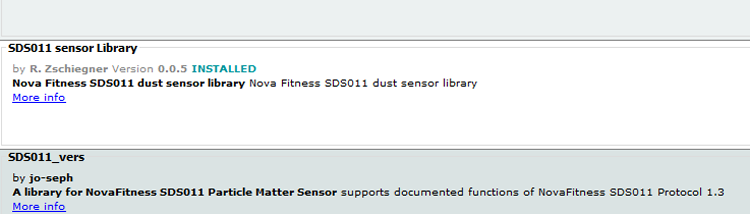
The code uses the SDS011, Adafruit_GFX, Adafruit_SSD1306, Adafruit_MQTT, and DHT.h libraries. The SDS011, Adafruit_GFX, and Adafruit_SSD1306 libraries can be downloaded from the Library Manager in the Arduino IDE and install from there. For that, open the Arduino IDE and go to Sketch < Include Library < Manage Libraries. Now search for SDS011 and install the SDS Sensor library by R. Zschiegner.
Similarly, install the Adafruit GFX and Adafruit SSD1306 libraries by Adafruit. The Adafruit_MQTT.h and DHT11.h can be downloaded from the given links.
After installing the libraries to Arduino IDE, start the code by including the needed libraries files.
#include <SDS011.h>
#include <SPI.h>
#include <WiFi.h>
#include "Adafruit_MQTT.h"
#include "Adafruit_MQTT_Client.h"
#include "DHT.h"
#include <Adafruit_GFX.h>
#include <Adafruit_SSD1306.h>
In the next lines, define the OLED display width and height. In this project, I have used a 128×64 SPI OLED display. You can change the SCREEN_WIDTH, and SCREEN_HEIGHT variables according to your display.
#define SCREEN_WIDTH 128
#define SCREEN_HEIGHT 64
Then define the SPI communication pins where OLED Display is connected.
#define OLED_MOSI  23
#define OLED_CLK   18
#define OLED_DC    4
#define OLED_CS    5
#define OLED_RESET 2
Then, create an instance for the Adafruit display with the width and height and SPI communication protocol that is defined earlier.
Adafruit_SSD1306 display(SCREEN_WIDTH, SCREEN_HEIGHT,
  OLED_MOSI, OLED_CLK, OLED_DC, OLED_RESET, OLED_CS);
Then include the WiFi and Adafruit IO credentials that you copied from the Adafruit IO server. These will include the MQTT server, Port No, User Name, and AIO Key.
const char *ssid =  "Galaxy-M20";
const char *pass =  "ac312124";
#define MQTT_SERV "io.adafruit.com"
#define MQTT_PORT 1883
#define MQTT_NAME "choudharyas"
#define MQTT_PASS "988c4e045ef64c1b9bc8b5bb7ef5f2d9"
Then set up the Adafruit IO feeds for storing the sensor data. In my case, I have defined six feeds to store different sensor data, namely: AirQuality, Temperature, Humidity, PM10, PM25, and CO.
Adafruit_MQTT_Client mqtt(&client, MQTT_SERV, MQTT_PORT, MQTT_NAME, MQTT_PASS);
Adafruit_MQTT_Publish AirQuality = Adafruit_MQTT_Publish(&mqtt,MQTT_NAME "/f/AirQuality");
Adafruit_MQTT_Publish Temperature = Adafruit_MQTT_Publish(&mqtt,MQTT_NAME "/f/Temperature");
Adafruit_MQTT_Publish Humidity = Adafruit_MQTT_Publish(&mqtt,MQTT_NAME "/f/Humidity");
Adafruit_MQTT_Publish PM10 = Adafruit_MQTT_Publish(&mqtt,MQTT_NAME "/f/PM10");
Adafruit_MQTT_Publish PM25 = Adafruit_MQTT_Publish(&mqtt,MQTT_NAME "/f/PM25");
Adafruit_MQTT_Publish CO = Adafruit_MQTT_Publish(&mqtt,MQTT_NAME "/f/CO");
Now inside the setup() function, initialize the Serial Monitor at a baud rate of 9600 for debugging purposes. Also Initialize the OLED display, DHT sensor, and SDS011 sensor with the begin() function.
void setup()
{
       my_sds.begin(16,17);
       Serial.begin(9600);
       dht.begin();
       display.begin(SSD1306_SWITCHCAPVCC);
The for loop inside the setup function is used to collect the values up to a defined number and then set the counter to zero.
for (int thisReading1 = 0; thisReading1 < numReadingsPM10; thisReading1++) {
        readingsPM10[thisReading1] = 0;
      }
Reading the Sensor Values:
Now inside the loop function, use the millis() method to read the sensor values in every one hour. Each of the gas sensors outputs an analog value from 0 to 4095. To convert this value into voltage, use the following equation: RvRo = MQ7Raw * (3.3 / 4095); where MQ7Raw is the analog value from the analog pin of the sensor. Also, read the PM2.5 and PM10 readings from the SDS011 sensor.
if ((unsigned long)(currentMillis - previousMillis) >= interval) {
MQ7Raw = analogRead( iMQ7 );
RvRo = MQ7Raw * (3.3 / 4095);
MQ7ppm = 3.027*exp(1.0698*( RvRo ));
Serial.println(MQ7ppm);
error = my_sds.read(&p25,&p10);
     if (! error) {
     Serial.println("P2.5: "+String(p25));
     Serial.println("P10:  "+String(p10));
     }
           }
Converting the Values:
The PM2.5 and PM10 values are already in µg/m3 but we need to convert the Carbon Monoxide values from PPM to mg/m3. The conversion formula is given below:
Concentration (mg/m3) = Concentration (PPM) × (Molecular Mass (g/mol) / Molar Volume (L))
Where: Molecular Mass of CO is 28.06 g/mol and Molar Volume is 24.45L at 25 0C
ConcentrationINmgm3 = MQ7ppm* (28.06/24.45);
 Serial.println(ConcentrationINmgm3);
Calculating 24-Hour Average:
Then in the next lines, calculate the 24 hour average for PM10, PM2.5 reading, and 8 hour average for Carbon Monoxide readings. In the first line of code, take the current total and subtract the first element in the array, now save this as the new total. Initially, it will be Zero. Then get the sensor values and add the current reading to the total and increase the number index. If the value of the index is equal to or greater than numReadings, then set the index back to zero.
    totalPM10 = totalPM10 - readingsPM10[readIndexPM10];
     readingsPM10[readIndexPM10] = p10;
     totalPM10 = totalPM10 + readingsPM10[readIndexPM10];
     readIndexPM10 = readIndexPM10 + 1;
     if (readIndexPM10 >= numReadingsPM10) {
      readIndexPM10 = 0;
     }
Then, at last, publish these values on Adafruit IO.
if (! Temperature.publish(temperature))
       {
         delay(30000);
          }
     if (! Humidity.publish(humidity))
       {
         delay(30000);
……………………………………………………….
……………………………………………………….
3D Printed Casing for AQI Monitoring System
Next, I measured the dimensions of the setup using my vernier and also measured the dimensions of the sensors and OLED to design a casing. My design looked something like this below, once it was done.
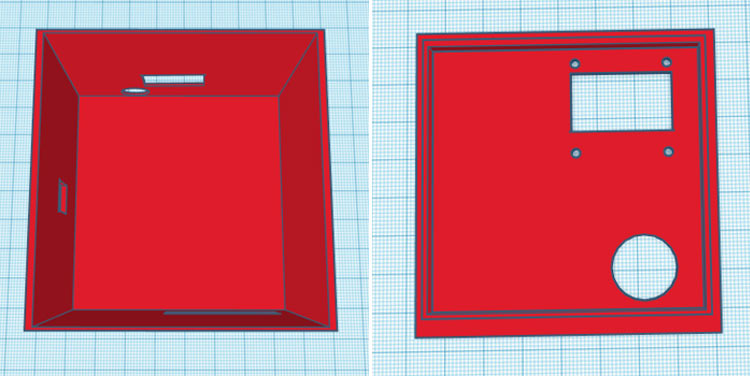
After I was satisfied with the design, I exported it as an STL file, sliced it based on printer settings, and finally printed it. Again the STL file is also available for download from Thingiverse and you can print your casing using it.
After the print was done, I proceeded with assembling the project set up in a permanent enclosure to install it in a facility. With the complete connection made, I assembled the circuit into my casing and everything was a nice fit as you can see here.
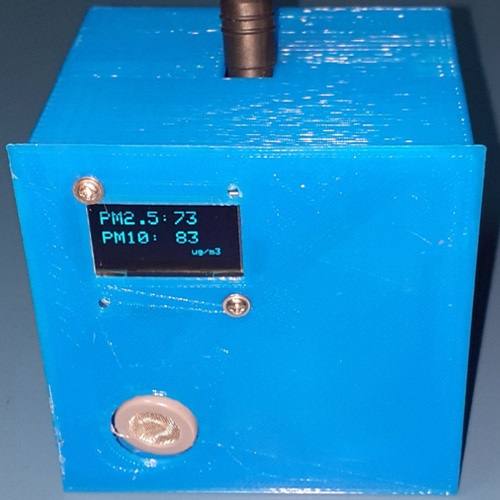
Testing the AQI Monitoring System
Once the hardware and code are ready, it is time to test the device. We used an external 12V 1A adapter to power the device. As you can see, the device will display the Concentration of PM10, PM2.5, and Carbon Monoxide on OLED Display. The concentration of PM2.5 and PM10 are in µg/m3 while the concentration of Carbon Monoxide is in mg/m3.
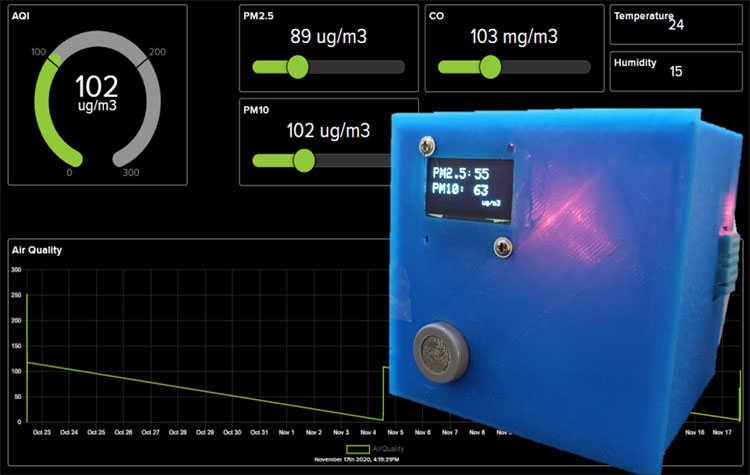
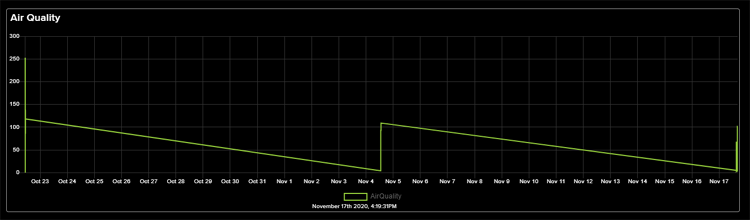
These readings will also be published on the Adafruit IO Dashboard. The maximum of all parameters (PM10, PM2.5 & CO) will be the AQI.
The AQI values of the last 30 days will be shown as a graph.
This is how you can use the SDS011 and MQ-7 sensors to calculate the Air Quality Index. The complete working of the project can also be found in the video linked below. Hope you enjoyed the project and found it interesting to build your own. If you have any questions, please leave them in the comment section below.
Complete Project Code
#include <SDS011.h>
#include <SPI.h>
#include <WiFi.h>
#include "Adafruit_MQTT.h"
#include "Adafruit_MQTT_Client.h"
#include "DHT.h"
#include <Adafruit_GFX.h>
#include <Adafruit_SSD1306.h>
#include "esp32-hal-adc.h" // needed for adc pin reset
#include "soc/sens_reg.h" // needed for adc pin reset
uint64_t reg_b; // Used to store Pin registers
#define SCREEN_WIDTH 128 // OLED display width, in pixels
#define SCREEN_HEIGHT 64 // OLED display height, in pixels
// Declaration for SSD1306 display connected using software SPI (default case):
#define OLED_MOSI  23
#define OLED_CLK   18
#define OLED_DC    4
#define OLED_CS    5
#define OLED_RESET 2
Adafruit_SSD1306 display(SCREEN_WIDTH, SCREEN_HEIGHT,
  OLED_MOSI, OLED_CLK, OLED_DC, OLED_RESET, OLED_CS);
const int numReadingsPM10 = 24;
const int numReadingsPM25 = 24;
const int numReadingsCO = 8;
WiFiClient client;
SDS011 my_sds;
const char *ssid =  "Galaxy-M20";     // Enter your WiFi Name
const char *pass =  "ac312124"; // Enter your WiFi Password
#define MQTT_SERV "io.adafruit.com"
#define MQTT_PORT 1883
#define MQTT_NAME "choudharyas" // Your Adafruit IO Username
#define MQTT_PASS "988c4e045ef64c1b9bc8b5bb7ef5f2d9" // Adafruit IO AIO key
#define DHTTYPE DHT11 // DHT 11
uint8_t DHTPin = 27;
DHT dht(DHTPin, DHTTYPE);
int error;
unsigned long interval = 3600000;
unsigned long previousMillis = 0;
int temperature, humidity, AQI;
float p10,p25;
int iMQ7 = 25;
int MQ7Raw = 0;
int MQ7ppm = 0;
double RvRo;
int ConcentrationINmgm3;
int readingsPM10[numReadingsPM10];      // the readings from the analog input
int readIndexPM10 = 0;              // the index of the current reading
int totalPM10 = 0;                  // the running total
int averagePM10 = 0;                // the average
int readingsPM25[numReadingsPM25];      // the readings from the analog input
int readIndexPM25 = 0;              // the index of the current reading
int totalPM25 = 0;                  // the running total
int averagePM25 = 0;                // the average
int readingsCO[numReadingsCO];      // the readings from the analog input
int readIndexCO = 0;              // the index of the current reading
int totalCO = 0;                  // the running total
int averageCO = 0;                // the average
Adafruit_MQTT_Client mqtt(&client, MQTT_SERV, MQTT_PORT, MQTT_NAME, MQTT_PASS);
Adafruit_MQTT_Publish AirQuality = Adafruit_MQTT_Publish(&mqtt,MQTT_NAME "/f/AirQuality");
Adafruit_MQTT_Publish Temperature = Adafruit_MQTT_Publish(&mqtt,MQTT_NAME "/f/Temperature");
Adafruit_MQTT_Publish Humidity = Adafruit_MQTT_Publish(&mqtt,MQTT_NAME "/f/Humidity");
Adafruit_MQTT_Publish PM10 = Adafruit_MQTT_Publish(&mqtt,MQTT_NAME "/f/PM10");
Adafruit_MQTT_Publish PM25 = Adafruit_MQTT_Publish(&mqtt,MQTT_NAME "/f/PM25");
Adafruit_MQTT_Publish CO = Adafruit_MQTT_Publish(&mqtt,MQTT_NAME "/f/CO");
//Adafruit_MQTT_Publish NH3 = Adafruit_MQTT_Publish(&mqtt,MQTT_NAME "/f/NH3");
void setup()
{
       my_sds.begin(16,17);
       Serial.begin(9600);
       dht.begin();
       display.begin(SSD1306_SWITCHCAPVCC);
       delay(10);
       pinMode(DHTPin, INPUT);
       pinMode(iMQ7, INPUT);
       Serial.println("Connecting to ");
       Serial.println(ssid);
       reg_b = READ_PERI_REG(SENS_SAR_READ_CTRL2_REG);
       WiFi.begin(ssid, pass);
       while (WiFi.status() != WL_CONNECTED)
     {
            delay(550);
            Serial.print(".");
     }
      Serial.println("");
      Serial.println("WiFi connected");
      for (int thisReading1 = 0; thisReading1 < numReadingsPM10; thisReading1++) {
        readingsPM10[thisReading1] = 0;
      }
      for (int thisReading2 = 0; thisReading2 < numReadingsPM25; thisReading2++) {
        readingsPM25[thisReading2] = 0;
      }
      for (int thisReading3 = 0; thisReading3 < numReadingsCO; thisReading3++) {
        readingsCO[thisReading3] = 0;
      }
      display.clearDisplay();
      display.display();
 }
void loop()
{
     unsigned long currentMillis = millis();
     MQTT_connect();
     if ((unsigned long)(currentMillis - previousMillis) >= interval) {
     WRITE_PERI_REG(SENS_SAR_READ_CTRL2_REG, reg_b);
     MQ7Raw = analogRead( iMQ7 );
     Serial.print("MQ Raw: ");
     Serial.println(MQ7Raw);
     RvRo = MQ7Raw * (3.3 / 4095);
     MQ7ppm = 3.027*exp(1.0698*( RvRo ));
     Serial.print("CO: ");
     Serial.println(MQ7ppm);
     //Serial.println();
     error = my_sds.read(&p25,&p10);
     if (! error) {
     Serial.println("P2.5: "+String(p25));
     Serial.println("P10:  "+String(p10));
     }
      }
     temperature = dht.readTemperature();
     humidity = dht.readHumidity();
     Serial.print("Temperature: ");
     Serial.print(temperature);
     Serial.println();
     Serial.print("Humidity: ");
     Serial.print(humidity);
     Serial.println();
     ConcentrationINmgm3 = MQ7ppm* (28.06/24.45); //Converting PPM to mg/m3. Where 28.06 is Molecular mass of CO and 24.45 is the Molar volume
     Serial.print("mg/m3: "); // for more inforation on this follow: https://www.markes.com/Resources/Frequently-asked-questions/How-do-I-convert-units.aspx
     Serial.println(ConcentrationINmgm3);
     totalPM10 = totalPM10 - readingsPM10[readIndexPM10];
     readingsPM10[readIndexPM10] = p10;
     totalPM10 = totalPM10 + readingsPM10[readIndexPM10];
     readIndexPM10 = readIndexPM10 + 1;
     if (readIndexPM10 >= numReadingsPM10) {
      readIndexPM10 = 0;
     }
     averagePM10 = totalPM10 / numReadingsPM10;
     Serial.print("PM10 Average: ");
     Serial.println(averagePM10);
     totalPM25 = totalPM25 - readingsPM25[readIndexPM25];
     readingsPM25[readIndexPM25] = p25;
     totalPM25 = totalPM25 + readingsPM25[readIndexPM25];
     readIndexPM25 = readIndexPM25 + 1;
     if (readIndexPM25 >= numReadingsPM25) {
      readIndexPM25 = 0;
     }
     averagePM25 = totalPM25 / numReadingsPM25;
     Serial.print("PM2.5 Average: ");
     Serial.println(averagePM25);
     totalCO = totalCO - readingsCO[readIndexCO];
     readingsCO[readIndexCO] = ConcentrationINmgm3;
     totalCO = totalCO + readingsCO[readIndexCO];
     readIndexCO = readIndexCO + 1;
     if (readIndexCO >= numReadingsCO) {
      readIndexCO = 0;
     }
     averageCO = totalCO / numReadingsCO;
     Serial.print("CO Average: ");
     Serial.println(averageCO);
     if (averagePM10 > averagePM25){
        AQI = averagePM10;
       }
     else {
       AQI = averagePM25;
      }
     if (! Temperature.publish(temperature))
       {
         delay(30000);
          }
     if (! Humidity.publish(humidity))
       {
         delay(30000);
          }
     if (! PM10.publish(averagePM10))
       {
         delay(30000);
          }
     if (! PM25.publish(averagePM25))
       {
         delay(30000);
          }
     if (! CO.publish(MQ7ppm))
       {
         delay(30000);
          }
     if (! AirQuality.publish(AQI))
       {
         delay(30000);
          }
     displayvalues();
    delay(10000);
    //delay(3000);
}
void displayvalues()
{
    display.clearDisplay();
    display.setTextSize(2);
    display.setCursor(0,15);
    display.println("CO: ");
    display.setCursor(40,15);
    display.println(averageCO);
    display.setTextSize(1);
    display.setCursor(68,35);
    display.println("mg/m3");
    display.display();
    delay(2000);
    display.clearDisplay();
    display.setTextSize(2);
    display.setCursor(0,5);
    display.println("Temp:");
    display.setCursor(75,5);
    display.println(temperature);
    display.setCursor(101,5);
    display.println("C");
    display.setCursor(0,28);
    display.println("Humid:");
    display.setCursor(75,28);
    display.println(humidity);
    display.setCursor(101,28);
    display.println("%");
    display.display();
    display.clearDisplay();
    delay(2000);
    display.setTextSize(2);
    display.setTextColor(WHITE);
    display.setCursor(0,5);
    display.println("PM2.5: ");
    display.setCursor(75,5);
    display.println(averagePM25);
    display.setCursor(0,28);
    display.println("PM10: ");
    display.setCursor(75,28);
    display.println(averagePM10);
    display.setTextSize(1);
    display.setCursor(90,49);
    display.println("ug/m3");
    display.display();
    delay(2000);
}
void MQTT_connect()
{
  int8_t ret;
  // Stop if already connected.
  if (mqtt.connected())
  {
    return;
  }
  uint8_t retries = 3;
  while ((ret = mqtt.connect()) != 0) // connect will return 0 for connected
  {
       mqtt.disconnect();
       delay(5000);  // wait 5 seconds
       retries--;
       if (retries == 0)
       {
         // basically die and wait for WDT to reset me
         while (1);
       }
  }
}
Hello sir
We aren't able to find a library named SoftwareSerial.h
Please help us with that