
An earthquake is an unpredictable natural disaster that causes damage to lives and property. It happens suddenly and we cannot stop it but we can be alerted from it. In today’s time, there are many technologies which can be used to detect the small shakes and knocks, so that we can take precautions prior to some major vibrations in earth. Here we are using Accelerometer ADXL335 to detect the pre-earthquake vibrations. Accelerometer ADXL335 is highly sensitive to shakes and vibrations along with all the three axes. Here we are building an Arduino based Earthquake Detector using Accelerometer.
We are here building this Earthquake detector as a Arduino Shield on PCB and will also show the Vibrations Graph on computer using Processing.
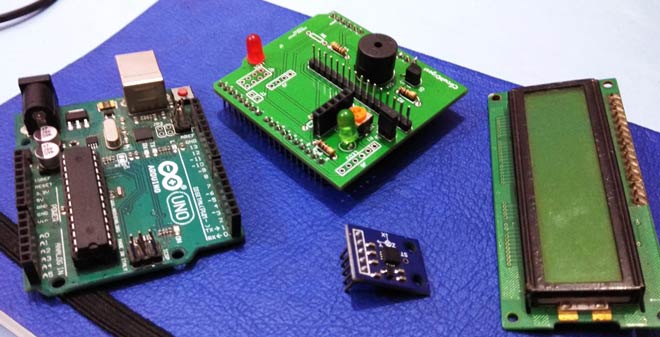
Components Required for Arduino Earthquake Detector Shield
- Arduino UNO
- Accelerometer ADXL335
- 16x2 LCD
- Buzzer
- BC547 transistor
- 1k Resistors
- 10K POT
- LED
- Power Supply 9v/12v
- Berg sticks male/female
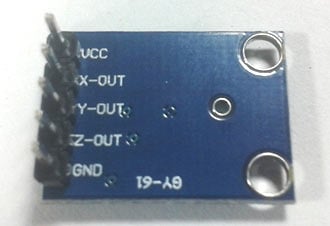
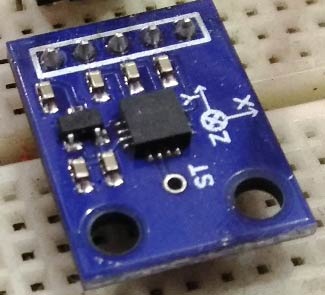
Accelerometer:
Pin Description of accelerometer:
- Vcc 5 volt supply should connect at this pin.
- X-OUT This pin gives an Analog output in x direction
- Y-OUT This pin give an Analog Output in y direction
- Z-OUT This pin gives an Analog Output in z direction
- GND Ground
- ST This pin used for set sensitivity of sensor
Also check our other projects using Accelerometer:
- Ping Pong Game using Arduino
- Accelerometer Based Hand Gesture Controlled Robot.
- Arduino Based Vehicle Accident Alert System using GPS, GSM and Accelerometer
Working Explanation:
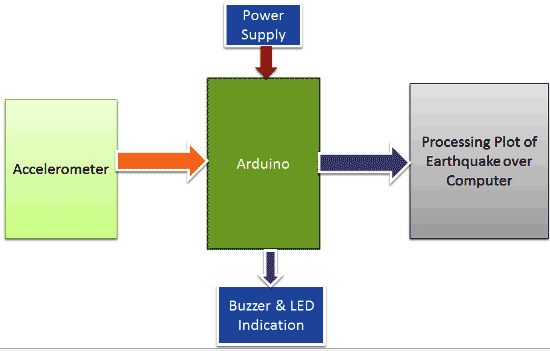
Working of this Arduino Earthquake Detector is quite simple. As we mentioned earlier that we have used Accelerometer for detecting earthquake vibrations along any of the three axes so that whenever vibrations occur accelerometer senses that vibrations and convert them into equivalent ADC value. Then these ADC values are read by Arduino and shown over the 16x2 LCD. We have also shown these values on Graph using Processing. Learn more about Accelerometer by going through our other Accelerometer projects here.
First we need to calibrate the Accelerometer by taking the samples of surrounding vibrations whenever Arduino Powers up. Then we need to subtract those sample values from the actual readings to get the real readings. This calibration is needed so that it will not show alerts with respect to its normal surrounding vibrations. After finding real readings, Arduino compares these values with predefined max and min values. If Arduino finds any changes values are more then or less then the predefined values of any axis in both direction (negative and positive) then Arduino trigger the buzzer and shows the status of alert over the 16x2 LCD and a LED also turned on as well. We can adjust the sensitivity of Earthquake detector by changing the Predefined values in Arduino code.
Demonstration Video and Arduino Code are given at the end of the article.
Circuit Explanation:
Circuit for this Earthquake detector Arduino Shield PCB is also simple. In this project, we have used Arduino that reads accelerometer’s analog voltage and convert them into the digital values. Arduino also drives the buzzer, LED, 16x2 LCD and calculate and compare values and take appropriate action. Next part is Accelerometer which detects vibration of earth and generates analog voltages in 3 axes (X, Y, and Z). LCD is used for showing X, Y and Z axis’s change in values and also showing alert message over it. This LCD is attached to Arduino in 4-bit mode. RS, GND, and EN pins are directly connected to 9, GND and 8 pins of Arduino and rest of 4 data pins of LCD namely D4, D5, D6 and D7 are directly connected to digital pin 7, 6, 5 and 4 of Arduino. The buzzer is connected to pin 12 of Arduino through an NPN BC547 transistor. A 10k pot is also used for controlling the brightness of the LCD.

Programming Explanation:
In this Arduino earthquake Detector Project, we have made two codes: one for Arduino to detect an earthquake and another for Processing IDE to plot the earthquake vibrations over the graph on Computer. We will learn about both the codes one by one:
Arduino code:
First of all, we calibrate the accelerometer with respect to its placing surface, so that it will not show alerts with respect to its normal surrounding vibrations. In this calibration, we take some samples and then take an average of them and stores in a variable.
  for(int i=0;i<samples;i++)      // taking samples for calibration
  {
    xsample+=analogRead(x);
    ysample+=analogRead(y);
    zsample+=analogRead(z);
  }

  xsample/=samples;   // taking avg for x
  ysample/=samples;   // taking avg for y
  zsample/=samples;   // taking avg for z

  delay(3000);
  lcd.clear();
  lcd.print("Calibrated");
  delay(1000);
  lcd.clear();
  lcd.print("Device Ready");
  delay(1000);
  lcd.clear();
  lcd.print(" X     Y     Z   ");
Now whenever Accelerometer takes readings, we will subtract those sample values from the readings so that it can ignore surroundings vibrations.
    int value1=analogRead(x);   // reading x out
    int value2=analogRead(y);   //reading y out
    int value3=analogRead(z);   //reading z out

    int xValue=xsample-value1;    // finding change in x
    int yValue=ysample-value2;    // finding change in y
    int zValue=zsample-value3;    // finding change in z

  /*displying change in x,y and z axis values over lcd*/
    lcd.setCursor(0,1);
    lcd.print(zValue);
    lcd.setCursor(6,1);
    lcd.print(yValue);
    lcd.setCursor(12,1);
    lcd.print(zValue);
    delay(100)
Then Arduino compares those calibrated (subtracted) values with predefined limits. And take action accordingly. If the values are higher than predefined values then it will beep the buzzer and plot the vibration graph on computer using Processing.
      /* comparing change with predefined limits*/
    if(xValue < minVal || xValue > maxVal  || yValue < minVal || yValue > maxVal  || zValue < minVal || zValue > maxVal)
    {
      if(buz == 0)
      start=millis();   // timer start
       buz=1;       // buzzer / led flag activated
    }

   else if(buz == 1)        // buzzer flag activated then alerting earthquake
   {
      lcd.setCursor(0,0);
      lcd.print("Earthquake Alert   ");
      if(millis()>= start+buzTime)
      buz=0;
   }
Processing code:
Below is the Processing Code attached, you can download the code from below link:
Earth Quake Detector Processing Code
We have designed a graph using Processing, for earth quake vibrations, in which we defined the size of the window, units, font size, background, reading and displaying serial ports, open selected serial port etc.
 // set the window size:  and Font size
  f6 = createFont("Arial",6,true);
  f8 = createFont("Arial",8,true);
  f10 = createFont("Arial",10,true);
  f12 = createFont("Arial",12,true);
  f24 = createFont("Arial",24,true);
  size(1200, 700);

 // List all the available serial ports
 println(Serial.list());
 myPort = new Serial(this, "COM43", 9600);
 println(myPort);
 myPort.bufferUntil('\n');
 background(80)
In below function, we have received data from serial port and extract required data and then mapped it with the size of the graph.
 // extracting all required values of all three axis:
 int l1=inString.indexOf("x=")+2;
 String temp1=inString.substring(l1,l1+3);
 l1=inString.indexOf("y=")+2;
 String temp2=inString.substring(l1,l1+3);
 l1=inString.indexOf("z=")+2;
 String temp3=inString.substring(l1,l1+3);

 //mapping x, y and z value with graph dimensions
 float inByte1 = float(temp1+(char)9);
 inByte1 = map(inByte1, -80,80, 0, height-80);
 float inByte2 = float(temp2+(char)9);
 inByte2 = map(inByte2,-80,80, 0, height-80);
 float inByte3 = float(temp3+(char)9);
 inByte3 = map(inByte3,-80,80, 0, height-80);
 float x=map(xPos,0,1120,40,width-40);
After this, we have plotted unit space, max and min limits, values of x, y and z-axis.
  //ploting graph window, unit
  strokeWeight(2);
  stroke(175);
  Line(0,0,0,100);
  textFont(f24);
  fill(0,00,255);
  textAlign(RIGHT);
  xmargin("EarthQuake Graph By Circuit Digest",200,100);

   fill(100);
   strokeWeight(100);
   line(1050,80,1200,80);
   .... ....
   ..........
After this we plot the values over the graph by using 3 different colors as Blue for x-axis value, green color for y axis and z is represented by red color.
   stroke(0,0,255);
   if(y1 == 0)
   y1=height-inByte1-shift;
   line(x, y1, x+2, height-inByte1-shift) ;
   y1=height-inByte1-shift;

   stroke(0,255,0);
   if(y2 == 0)
   y2=height-inByte2-shift;
   line(x, y2, x+2, height-inByte2-shift) ;
   y2=height-inByte2-shift;

   stroke(255,0,0);
   if(y2 == 0)
   y3=height-inByte3-shift;
   line(x, y3, x+2, height-inByte3-shift) ;
   y3=height-inByte3-shift;
Also learn more about processing by going through our other Processing projects.
Circuit and PCB Design using EasyEDA:
EasyEDA is not only the one stop solution for schematic capture, circuit simulation and PCB design, they also offer a low cost PCB Prototype and Components Sourcing service. They recently launched their component sourcing service where they have a large stock of electronic components and users can order their required components along with the PCB order.
While designing your circuits and PCBs, you can also make your circuit and PCB designs public so that other users can copy or edit them and can take benefit from there, we have also made our whole Circuit and PCB layouts public for this Earthquake Indicator Shield for Arduino UNO, check the below link:
https://easyeda.com/circuitdigest/EarthQuake_Detector-380c29e583b14de8b407d06ab0bbf70f
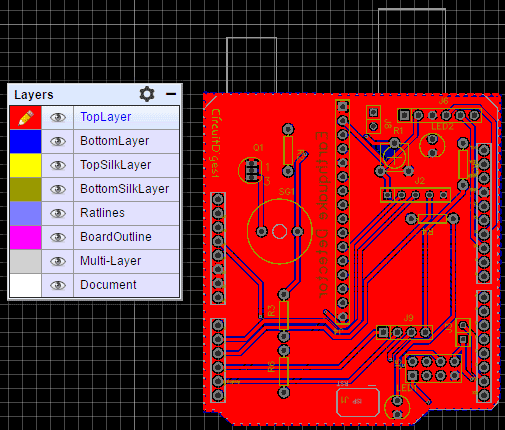
Below is the Snapshot of Top layer of PCB layout from EasyEDA, you can view any Layer (Top, Bottom, Topsilk, bottomsilk etc) of the PCB by selecting the layer form the ‘Layers’ Window.
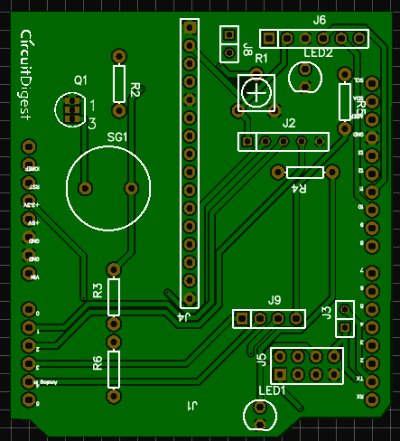
You can also see Photo view of PCB using EasyEDA:
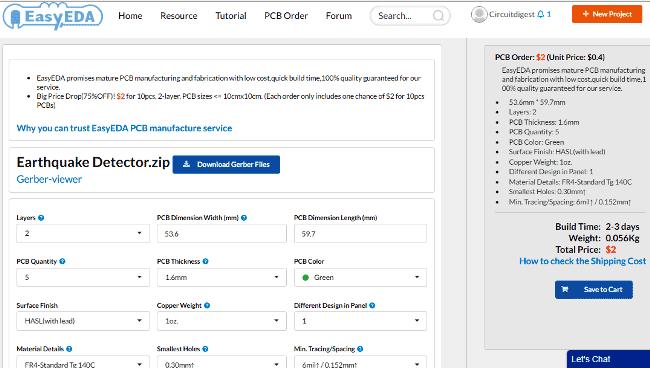
Calculating and Ordering Samples online:
After completing the design of PCB, you can click the icon of Fabrication output, which will take you on the PCB order page. Here you can view your PCB in Gerber Viewer or download Gerber files of your PCB. Here you can select the number of PCBs you want to order, how many copper layers you need, the PCB thickness, copper weight, and even the PCB color. After you have selected all of the options, click “Save to Cart” and complete your order. Recently they have dropped their PCB rates significantly and now you can order 10 pcs 2-layer PCB with 10cm x 10cm size just for $2.
Here is the PCBs I Got from EasyEDA:
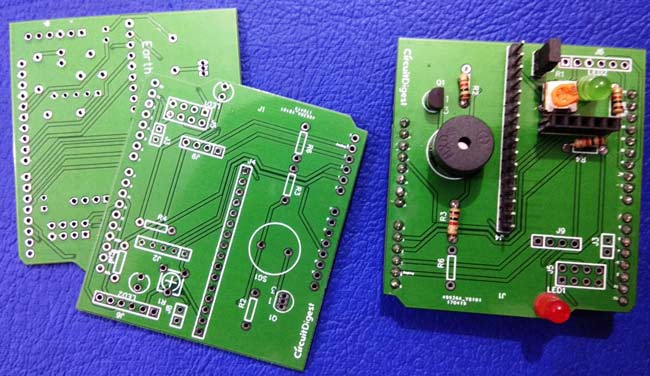
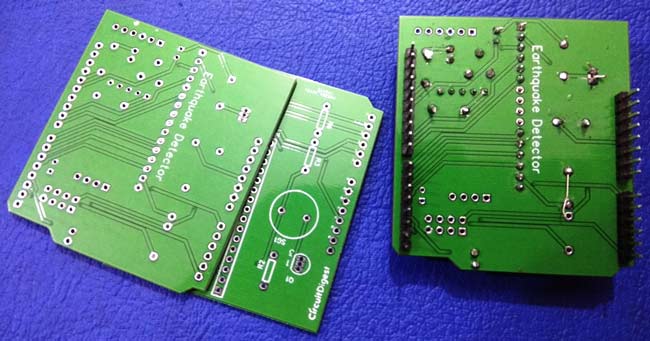
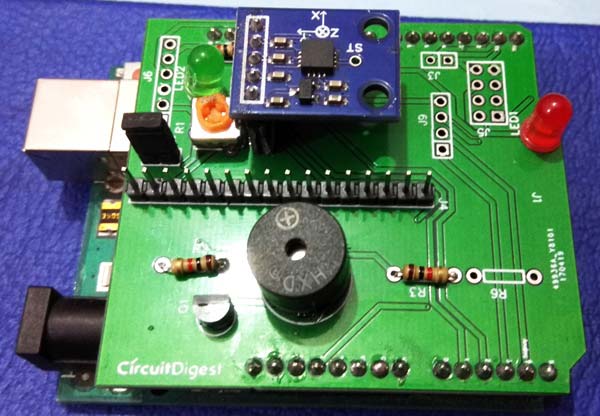
Below are the pictures of final Shield after soldering the components on PCB:
#include<LiquidCrystal.h> // lcd Header
LiquidCrystal lcd(9,8,7,6,5,4); // pins for LCD Connection
#define buzzer 12 // buzzer pin
#define led 13 //led pin
#define x A0 // x_out pin of Accelerometer
#define y A1 // y_out pin of Accelerometer
#define z A2 // z_out pin of Accelerometer
/*variables*/
int xsample=0;
int ysample=0;
int zsample=0;
long start;
int buz=0;
/*Macros*/
#define samples 50
#define maxVal 20 // max change limit
#define minVal -20 // min change limit
#define buzTime 5000 // buzzer on time
void setup()
{
lcd.begin(16,2); //initializing lcd
Serial.begin(9600); // initializing serial
delay(1000);
lcd.print("EarthQuake ");
lcd.setCursor(0,1);
lcd.print("Detector ");
delay(2000);
lcd.clear();
lcd.print("Circuit Digest ");
lcd.setCursor(0,1);
lcd.print("Saddam Khan ");
delay(2000);
lcd.clear();
lcd.print("Calibrating.....");
lcd.setCursor(0,1);
lcd.print("Please wait...");
pinMode(buzzer, OUTPUT);
pinMode(led, OUTPUT);
buz=0;
digitalWrite(buzzer, buz);
digitalWrite(led, buz);
for(int i=0;i<samples;i++) // taking samples for calibration
{
xsample+=analogRead(x);
ysample+=analogRead(y);
zsample+=analogRead(z);
}
xsample/=samples; // taking avg for x
ysample/=samples; // taking avg for y
zsample/=samples; // taking avg for z
delay(3000);
lcd.clear();
lcd.print("Calibrated");
delay(1000);
lcd.clear();
lcd.print("Device Ready");
delay(1000);
lcd.clear();
lcd.print(" X Y Z ");
}
void loop()
{
int value1=analogRead(x); // reading x out
int value2=analogRead(y); //reading y out
int value3=analogRead(z); //reading z out
int xValue=xsample-value1; // finding change in x
int yValue=ysample-value2; // finding change in y
int zValue=zsample-value3; // finding change in z
/*displying change in x,y and z axis values over lcd*/
lcd.setCursor(0,1);
lcd.print(zValue);
lcd.setCursor(6,1);
lcd.print(yValue);
lcd.setCursor(12,1);
lcd.print(zValue);
delay(100);
/* comparing change with predefined limits*/
if(xValue < minVal || xValue > maxVal || yValue < minVal || yValue > maxVal || zValue < minVal || zValue > maxVal)
{
if(buz == 0)
start=millis(); // timer start
buz=1; // buzzer / led flag activated
}
else if(buz == 1) // buzzer flag activated then alerting earthquake
{
lcd.setCursor(0,0);
lcd.print("Earthquake Alert ");
if(millis()>= start+buzTime)
buz=0;
}
else
{
lcd.clear();
lcd.print(" X Y Z ");
}
digitalWrite(buzzer, buz); // buzzer on and off command
digitalWrite(led, buz); // led on and off command
/*sending values to processing for plot over the graph*/
Serial.print("x=");
Serial.println(xValue);
Serial.print("y=");
Serial.println(yValue);
Serial.print("z=");
Serial.println(zValue);
Serial.println(" $");
}
Comments
same problem
brother , did you got the correct code? help me too . m also stuck on the programming . do help please
components list?
Can you share a list of the components for the PCB? I ordered the boards and some of the components but like what is J9 and R1? I can't find them anywhere online
J8 is just a male heder pin
J8 is just a male heder pin which can be used to connect or disconnect the buzzer from the circuit. It can be used to remove the buzzer from action
Programming
How sensitive is this? And is the programming codes working as is it? Thank you for the reply!
Could someone help me with

Could someone help me with this? Why am I getting this error and how do I resolve it and simulate the circuit?
Thank you!
Do you have the Gerber file…
Do you have the Gerber file so I can order the PCBs? I saw the images, but no file.

The y axis showing -1320 and both the x and z are showing the same values.
The buzzer and LED are glowing after the calibration is done and it doesn't show the earthquake alert
Pls help me with the arduino code.